Supply and Demand Zones
A precise indicator that identifies supply and demand zones by aggregating price data into synthetic candles, helping traders detect potential market reversal and breakout levels.
Explore 11,183 indicators. Filter beyond the obvious.
Discover the tools that fit the way you trade.
11,183 tools to explore
A precise indicator that identifies supply and demand zones by aggregating price data into synthetic candles, helping traders detect potential market reversal and breakout levels.
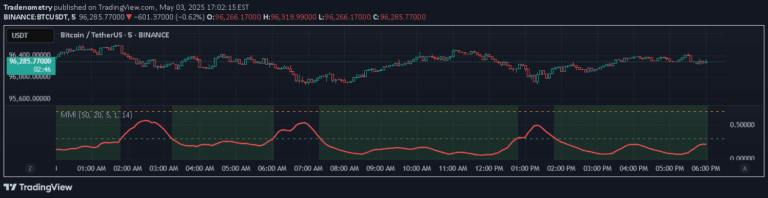
The Composite Manipulation Index (CMI) is a market integrity tool that quantifies structural chaos by analyzing price behavior's predictability and rhythmic deviation to detect potential market manipulation.
A sophisticated RSI variant that combines multiple RSI calculations and smoothing techniques to generate a more refined momentum indicator for tracking price strength and potential trend changes.
A synthetic price tracker that separates daily price movements into intraday and overnight components, allowing traders to analyze specific session return behaviors.
A synthetic price action generator designed for developers to create and test trading indicators by producing randomized but realistic-looking price candles with customizable parameters.
A pseudo-random asset data generator that creates simulated price and volume data with customizable parameters for testing and research purposes.
The Vix Fix is a synthetic volatility indicator that measures market fluctuations by calculating the percentage difference between the current low and the highest close over 22 days.
A dynamic support and resistance zone indicator that combines price bars into synthetic candles, highlighting key market levels and potential trading opportunities through visual and customizable zones.
A multi-timeframe trend analysis tool that creates a synthetic trend line using SMEMA across six different timeframes, providing a comprehensive market direction assessment.
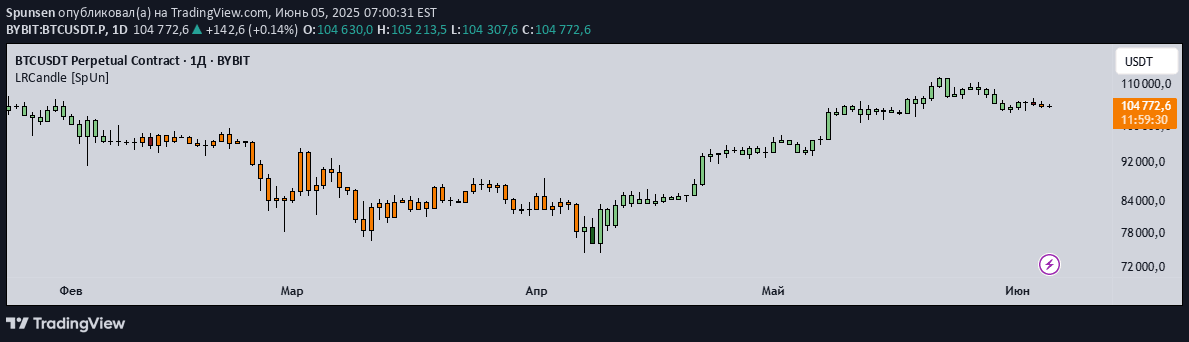
LRC is a linear regression-based indicator that smooths price candles, reducing market noise and providing trend confirmation through color-coded signals and crossovers.
A unique TradingView script that transforms RSI into visual candles, offering traders an innovative way to analyze trend strength and momentum through custom RSI-based charting.
A tool that creates synthetic aggregated candles by combining multiple bars into one, offering traders a broader perspective of price action without changing timeframes.
Likes, views, and comments are historical TradingView snapshots. They describe attention, not trading performance.