Smart Money Range [ChartPrime]
A comprehensive market structure indicator that highlights key support and resistance levels, tracks price interactions, and provides volume insights to help traders understand market dynamics.
Explore 11,183 indicators. Filter beyond the obvious.
Discover the tools that fit the way you trade.
11,183 tools to explore
A comprehensive market structure indicator that highlights key support and resistance levels, tracks price interactions, and provides volume insights to help traders understand market dynamics.
A dynamic support and resistance level indicator that scores potential trading zones based on volume, bounce frequency, and price interactions, providing visual insights into market structure.
A dynamic support and resistance indicator that identifies key price levels using pivot points, tracking market interest zones and providing insights into potential trading opportunities.
A dynamic VWAP-based indicator that identifies institutional supply and demand zones using volume and momentum confirmation, helping traders spot potential market reversals and continuations.
A volume profile indicator that analyzes volume distribution across price levels by breaking down price ranges into grids and proportionally attributing volume from lower timeframes.
Dynamic Touch Trendlines automatically draw and validate trend lines based on customizable touch requirements, helping traders identify support, resistance, and potential trend reversals.
Pivotal Moments tracks and draws pivot high and low levels on a chart, automatically removing levels when they are touched or crossed in real-time trading.
An advanced support and resistance indicator that dynamically identifies key price levels using multi-timeframe analysis and volume confirmation, with automatic role reversal capabilities.
An advanced trading indicator that detects dynamic support and resistance zones using pivot points, geometric moving averages, and real-time price action analysis to help traders identify potential market movements.
A multi-timeframe Fair Value Gap (FVG) indicator that identifies price imbalances and potential liquidity zones across different market perspectives.
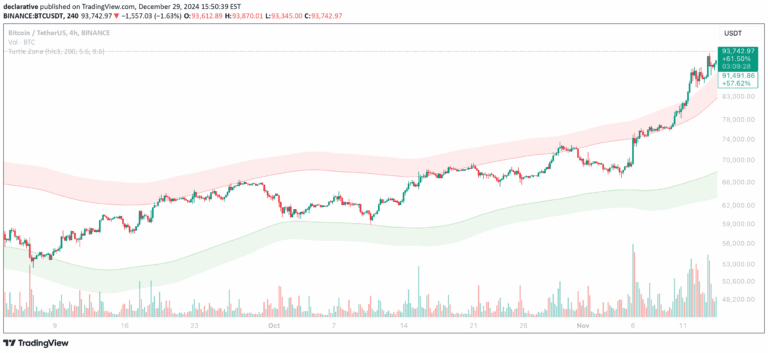
Turtle Zone is a dynamic channel indicator that uses volatility-adaptive moving average bands to identify potential support, resistance, and price movement zones.
A Bitcoin sentiment indicator comparing 28-day price changes with active address changes to predict potential market reversals and short-term price movements.
Likes, views, and comments are historical TradingView snapshots. They describe attention, not trading performance.