
YOUR INDICATOR RESEARCH STARTS HERE

Find the right indicator.
Understand what it does.

Explore 11,183 indicators. Filter beyond the obvious.
Discover the tools that fit the way you trade.

THE INDICATOR LIBRARY

Results for “underperformance”

11,183 tools to explore

15 indicators matching your filters
Save search
MomentumSignalTrend

RS - Relative Strength Score

by Lantzwat

Relative strength measures a stock's price performance compared to a market index, revealing how an asset performs relative to a benchmark over a specific time period.

Separate pane · unverifiedDay Trading · Swing Trading
Explore
503likes11Kviews6comments
Save
TrendMomentumSignal

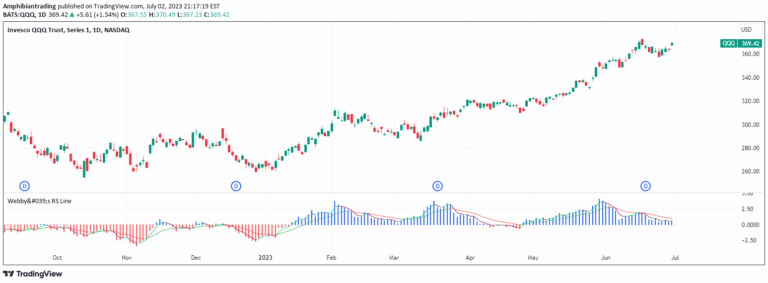
Webby's RS Line

by Amphibiantrading

A relative strength indicator that compares a stock's performance against the S&P 500 using low prices and exponential moving averages to identify momentum shifts.

Separate pane · unverifiedDay Trading · Swing Trading
Explore
422likes8.6Kviews10comments
Save
SignalTrend

Sector Relative Strength [Afnan]

by AfnanTAjuddin

A sector relative strength indicator that compares performance of multiple sector indices against a benchmark, helping traders identify outperforming and underperforming market segments.

Separate pane · unverifiedDay Trading · Swing Trading
Explore
398likes5.2Kviews6comments
Save
MomentumTrend

Saral Relative Strength

by bharat1911

The Relative Strength Indicator measures a security's performance against a benchmark, calculating outperformance or underperformance in percentage terms to provide comparative market insights.

Separate pane · unverifiedScalping · Day Trading
Explore
148likes2.2Kviews0comments
Save
SignalTrend

Ratio Chart with GMMA

by na-gi

A relative strength indicator that compares a stock's performance against an index by dividing their prices and plotting the GMMA to analyze trend strength and potential outperformance.

Separate pane · unverifiedSwing Trading
Explore
71likes2.3Kviews2comments
Save
SignalTrend

Relative Strength vs SPX

by joshbijari

A stock performance indicator comparing its price to the S&P 500 Index, revealing relative market strength through a dynamic ratio tracking and highlighting significant price movements.

Separate pane · unverifiedDay Trading · Swing Trading
Explore
55likes1.3Kviews0comments
Save
MomentumSignalTrend

Gaussian Average Rate Oscillator

by NantzOS

A trading strategy comparing Rate of Change indicators from Arnaud Legoux Moving Average and Exponential Moving Average to identify potential trend shifts and momentum changes.

Separate pane · unverifiedScalping · Day Trading
Explore
45likes1.7Kviews0comments
Save
MomentumTrend

Relative Price Strength (RPS)

by mabidou

Relative Price Strength (RPS) compares a symbol's performance against a benchmark, measuring its relative price movement and revealing potential outperformance or underperformance.

Separate pane · unverifiedDay Trading · Swing Trading
Explore
39likes1.3Kviews0comments
Save
LevelsSignalTrend

RS Theory Indicator

by aliashif

A relative strength indicator comparing an asset's performance against a benchmark, showing outperformance or underperformance through a dynamic ratio calculation.

Separate pane · unverifiedScalping · Day Trading
Explore
17likes351views0comments
Save

Likes, views, and comments are historical TradingView snapshots. They describe attention, not trading performance.

START WITH A QUESTION

A little less searching.
A lot more understanding.

Tell DeepAlpha what you need. Get an explanation, a shortlist,
and a direct path to the indicators behind it.

Ask DeepAlpha