Machine Learning Trendlines Cluster [LuxAlgo]
A machine learning-powered trendline indicator that uses k-means clustering to automatically identify and filter price trend clusters, offering dynamic trend visualization and analysis.
Explore 11,183 indicators. Filter beyond the obvious.
Discover the tools that fit the way you trade.
11,183 tools to explore
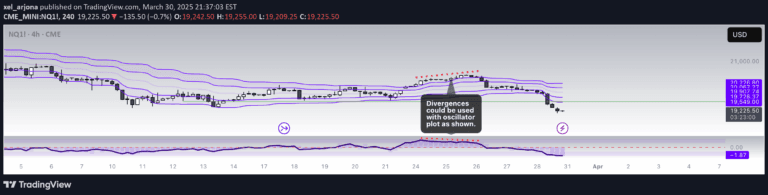
A machine learning-powered trendline indicator that uses k-means clustering to automatically identify and filter price trend clusters, offering dynamic trend visualization and analysis.
A precision trading tool for identifying market consolidation zones and generating dynamic breakout signals using volatility or trend strength metrics for strategic entry and exit points.
The Corrected Moving Average (CMA) is an adaptive moving average system designed to minimize false signals in sideways markets and provide more accurate trend identification across different market conditions.
An advanced volume analysis tool for crypto trading that aggregates volume data across multiple exchanges, offering customizable volume calculation and display methods.
A machine learning tool that groups tickers with similar correlation coefficients to help traders analyze asset relationships and optimize trading strategies.
An advanced statistical indicator using volume-weighted Student-T distribution to dynamically track market volatility, providing adaptive tension bands and a normalized price oscillator.
A sophisticated trading indicator using three kernel regression techniques to analyze market trends, identify potential reversals, and provide more reliable signals with reduced false positives.
A population sampled linear regression model that analyzes price momentum, distribution moments, and potential pivot points using statistical analysis and standard deviation tracking.
A unique moving average indicator that uses Probability Density Function (PDF) weighting to create an adaptive trend-following tool with dynamic candle coloring for enhanced market analysis.
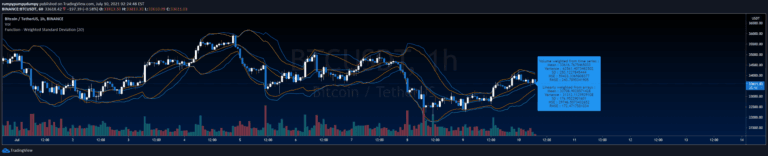
A statistical analysis function that calculates weighted mean, variance, standard deviation, and error metrics for time series data, helping traders understand data distribution and variability.
A comprehensive trading indicator combining volume analysis, Z-Score bands, autoregressive forecasting, and ANOVA variance analysis to identify potential market trends and trading opportunities.
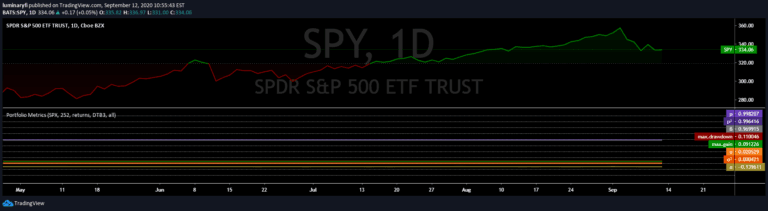
Portfolio metrics provide comprehensive insights into investment performance, analyzing returns, risk, and statistical measures to evaluate portfolio health and potential investment strategies.
Likes, views, and comments are historical TradingView snapshots. They describe attention, not trading performance.