CM MACD Custom Indicator - Multiple Time Frame - V2
CM MACD Ultimate Multi-Timeframe V2 is an advanced MACD indicator with enhanced customization options, multi-timeframe analysis, and comprehensive trend visualization features.
Explore 11,183 indicators. Filter beyond the obvious.
Discover the tools that fit the way you trade.
11,183 tools to explore
CM MACD Ultimate Multi-Timeframe V2 is an advanced MACD indicator with enhanced customization options, multi-timeframe analysis, and comprehensive trend visualization features.
A multi-timeframe support and resistance indicator that identifies key price levels, breakouts, tests, retests, and rejections to help traders understand market dynamics.
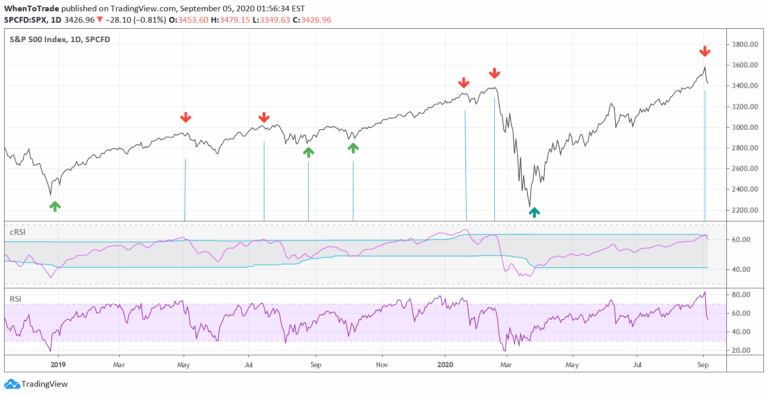
An enhanced RSI indicator that uses cyclic smoothing and adaptive bands to provide more responsive market trend signals by incorporating dominant cycle length.
A charting tool that measures traded volume and money flow across price levels, revealing trading activity, sentiment, and key market levels for strategic analysis.
A dynamic range detection indicator that identifies price consolidation zones, highlights range extremities, and signals potential breakouts using real-time color-coded markers.
A trading indicator that uses pivot points to identify supply and demand zones, market structure, and potential trading opportunities through visual analysis of price action.
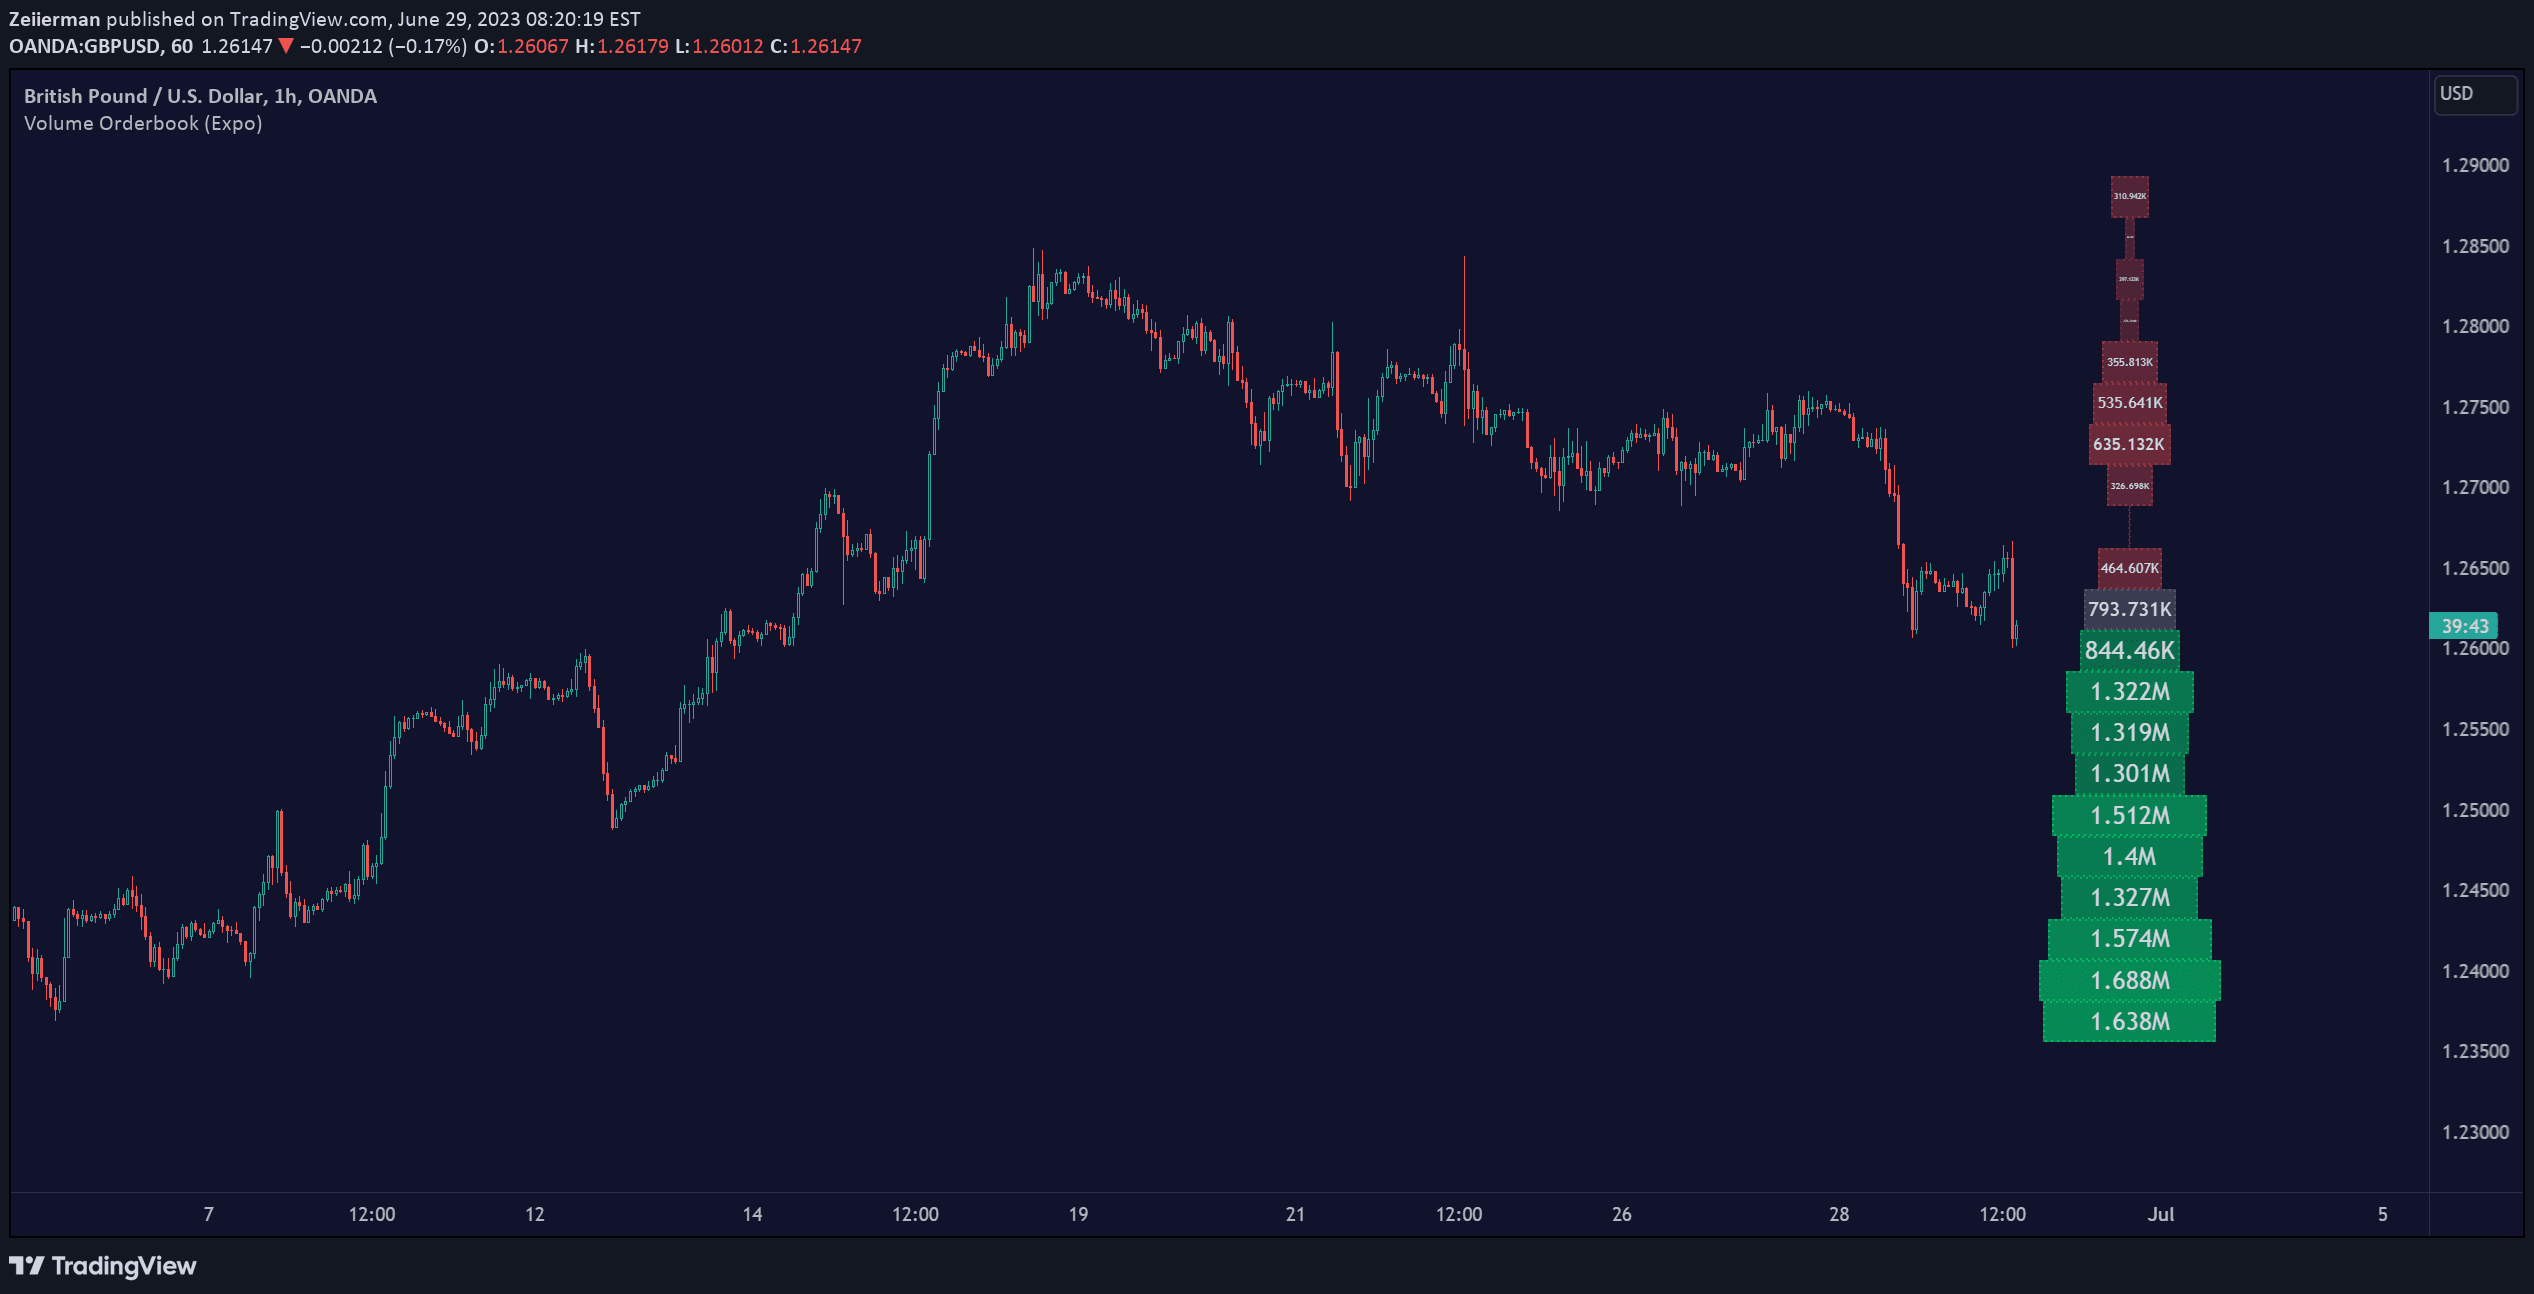
Volume Orderbook is a visual trading tool that displays trading volume across different price levels, helping traders identify significant market activity zones and potential support/resistance areas.
An FX market indicator that segments trading times into specific zones, providing visual guidance for traders using timeframes of 60 minutes or less.
SuperBollingerTrend combines Bollinger Bands and SuperTrend to analyze market volatility and trend direction, providing traders insights into potential trend changes and breakouts.
HARSI is a unique oscillator combining Heikin Ashi candles with RSI calculations, designed to reduce noise and provide smoother trend analysis for traders.
Tick Chart is a unique charting method that creates candlesticks based on a specific number of price ticks, offering an alternative to time-based charts for analyzing market movements.
Global Liquidity Index tracks worldwide central bank balance sheets, providing a comprehensive view of global monetary conditions and potential market trends through consolidated financial data.
Likes, views, and comments are historical TradingView snapshots. They describe attention, not trading performance.