Range Detector [LuxAlgo]
A dynamic range detection indicator that identifies price consolidation zones, highlights range extremities, and signals potential breakouts using real-time color-coded markers.
Explore 11,183 indicators. Filter beyond the obvious.
Discover the tools that fit the way you trade.
11,183 tools to explore
A dynamic range detection indicator that identifies price consolidation zones, highlights range extremities, and signals potential breakouts using real-time color-coded markers.
An indicator that identifies divergences between swing points of a chart symbol and two external tickers, providing statistical insights into price behavior correlation.
ICT Algorithmic Macro Tracker plots key trading time windows based on Inner Circle Trader methodology, helping traders identify potential market movement periods across specific time intervals.
A machine learning-powered moving average that uses Gaussian Process Regression to estimate price trends, with adjustable responsiveness and band extremities for identifying potential market reversals.
A trading tool highlighting specific time-based market zones and Fibonacci retracements to identify optimal entry points across different forex trading sessions.
An AI-powered trading indicator using k-Nearest Neighbors algorithm to analyze market trends, predict price movements, and provide intelligent trend navigation for traders.
A customizable Pine Script indicator that generates a mini-chart displaying the last 10 candles with detailed visual settings, providing quick insights into recent price action and market behavior.
Rolling Volume-Weighted Average Price (RVWAP) is a dynamic indicator that calculates a moving average price weighted by volume across a flexible time window, adapting to different chart timeframes.
A technical analysis tool that identifies price gaps between consecutive candlesticks, creating windows that signal potential trend continuation or reversal points.
A trading signal using Kadane's algorithm to identify the largest market impulse within a window, then applying Murrey's math lines to map potential price movements and trading opportunities.
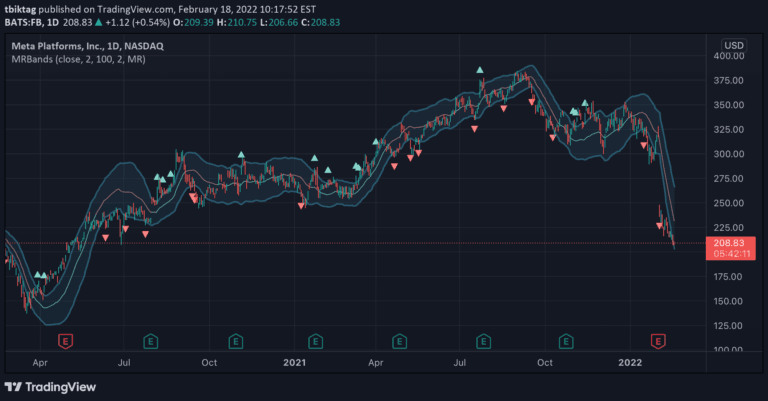
Moving Regression Prediction Bands combine regression analysis and statistical prediction to create a dynamic price prediction channel with upper and lower bands indicating potential price momentum and trend shifts.
AI Channels indicator uses K-means clustering to identify trend directions and potential price breakouts by analyzing price clusters and their centroids dynamically.
Likes, views, and comments are historical TradingView snapshots. They describe attention, not trading performance.