Built-in Kelly ratio for dynamic position sizing
A Keltner Channel strategy incorporating Kelly ratio for dynamic position sizing, with optional take-profit and stop-loss parameters to enhance trading performance and risk management.
Explore 11,183 indicators. Filter beyond the obvious.
Discover the tools that fit the way you trade.
11,183 tools to explore
A Keltner Channel strategy incorporating Kelly ratio for dynamic position sizing, with optional take-profit and stop-loss parameters to enhance trading performance and risk management.
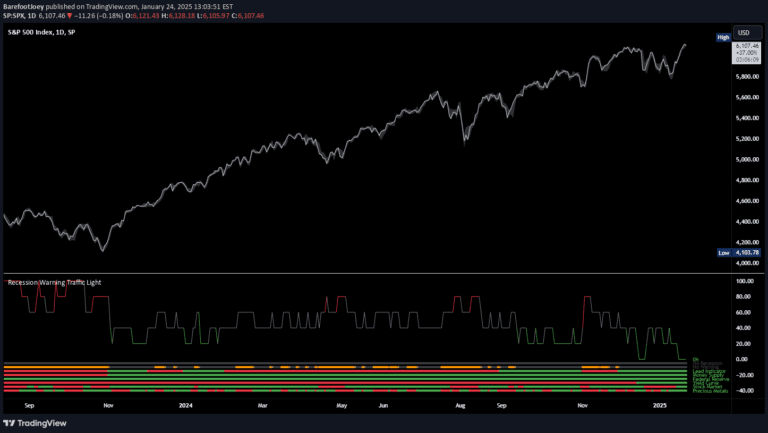
A multi-metric recession probability indicator using six key economic factors to assess potential economic downturns by analyzing various financial and market signals.
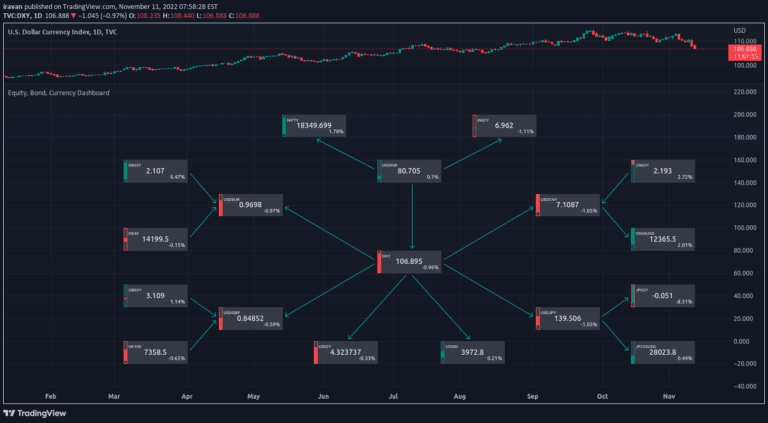
A comprehensive market flow visualization tool tracking demand dynamics across currencies, equities, and bonds of six countries, revealing interconnected market movements and smart money flows.
A comprehensive dividend tracking tool that helps investors analyze dividend payouts, forecast income, and make strategic investment decisions across various stocks and sectors.
A comprehensive market analysis tool tracking cross-market correlations and equity factor performance across multiple assets to provide probabilistic insights into macro market regimes and potential future movements.
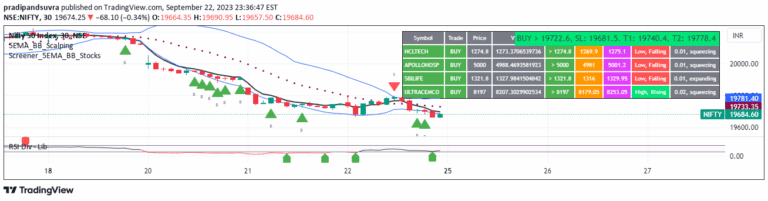
A dynamic trading scanner that identifies potential buy and sell signals for Nifty-50 stocks using 5-EMA and Bollinger Bands, providing real-time trade recommendations.
A comprehensive multi-factor quantitative model that assesses systemic market risk by integrating 13 risk factors across macroeconomic, technical, sentiment, and market breadth dimensions.
A widget tracking yield curve dynamics, allowing traders to compare current and historical yield curves and detect potential market inversions with a simple visual interface.
A comprehensive market analysis tool that monitors market trends, identifies potential trend reversals, and provides insights into market volatility and phase using advanced oscillator techniques.
A sophisticated liquidity momentum indicator that analyzes global financial trends by calculating a Liquidity Index and measuring its year-over-year percentage change using advanced oscillator techniques.
A yield curve indicator tracking the percentage of Treasury Bond yield spreads that are inverted, providing insights into potential economic downturns and market sentiment.
A composite z-score indicator using credit spreads and volatility indexes to assess market conditions and generate trading signals based on real-time market data.
Likes, views, and comments are historical TradingView snapshots. They describe attention, not trading performance.