
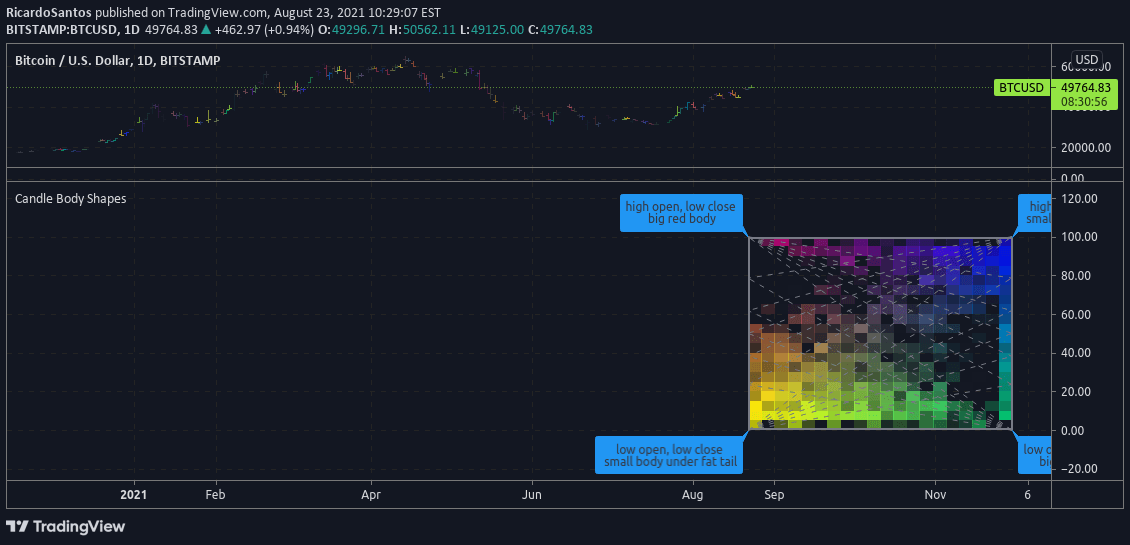
An experimental signal exploring the frequency and types of trading candlesticks. Provides insights into market behavior by tracking and categorizing different candlestick patterns and their occurrence.
Explore complementary indicator rolesHow it works
This signal analyzes trading charts to count and categorize different types of candlesticks based on their shape, color, and price movement characteristics. It tracks the frequency of specific candlestick formations like doji, hammer, engulfing, and spinning top patterns.
The system calculates the percentage and occurrence of each candlestick type across the analyzed timeframe. By creating a statistical breakdown, traders can understand the dominant candle patterns in a specific market or instrument. The analysis helps identify potential market sentiment and behavioral trends through visual candlestick representation
Why it may be useful
Understanding candlestick frequency provides traders with deeper insights into market psychology and potential trend reversals. Different candlestick patterns can signal trader sentiment, momentum shifts, and potential price action. By recognizing the prevalence of specific formations, traders can anticipate potential market movements.
This analytical approach helps identify recurring patterns that might indicate underlying market dynamics. Such statistical analysis can complement traditional technical analysis methods and provide a more nuanced view of market behavior
When to explore it
This signal works best in markets with clear, consistent price movements and sufficient trading volume. It is most effective when analyzing longer timeframes like daily or weekly charts to capture more comprehensive pattern data.
Traders should use this signal alongside other technical indicators to confirm potential trading decisions. It is particularly useful for identifying market sentiment during trending or consolidating periods. The signal can be applied across various financial instruments like stocks, forex, cryptocurrencies, and commodities
Keep exploring
What we’ve verified
Access, alerts and repainting behaviour have not been independently verified for this indicator. Check the creator’s current publication and settings.
General descriptions and classifications are recovered research. Verified details above identify the specific checks we have completed. Check the creator’s current publication for later changes.


