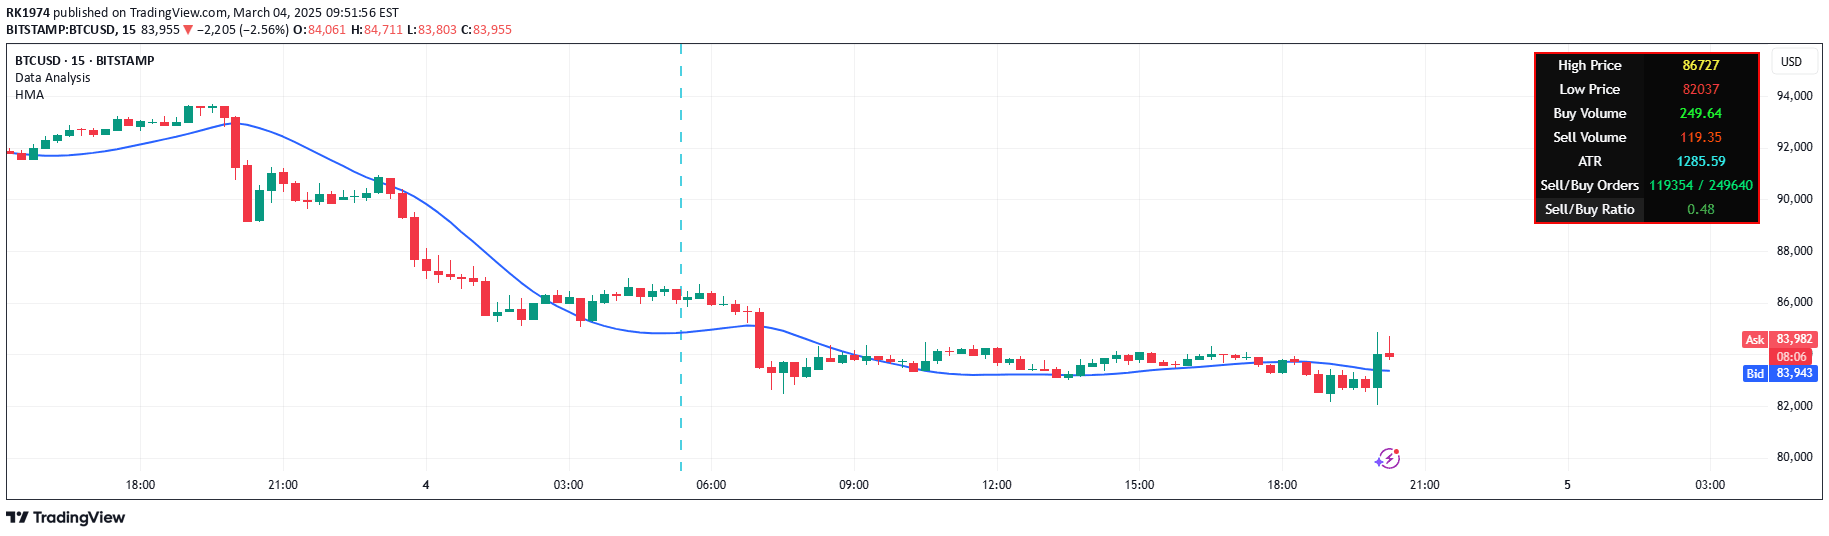
A price and volume indicator that visualizes market dynamics by plotting price candles above zero and volume histogram below zero, helping traders understand market trends and potential movements.
Explore complementary indicator rolesHow it works
The indicator uses a 9-period EMA on price as its primary calculation method, plotting price candles above the zero line and volume histogram below it. Traders can adjust multipliers for price and volume to ensure proper visualization, as price and volume have different numeric ranges.
By comparing the position of price candles and volume histograms relative to the zero line, traders can quickly interpret market sentiment and potential directional movements. The indicator provides a visual representation of market dynamics, showing whether the market is in a positive or negative phase.
Why it may be useful
This indicator offers traders a unique and intuitive way to understand market behavior by combining price and volume information in a single, easy-to-read format. It helps traders quickly assess market trends, volatility, and potential future price movements without complex mathematical calculations.
By providing a clear visual representation of market dynamics, the indicator allows traders to make more informed decisions about entry and exit points. The ability to adjust settings and multipliers makes it adaptable to different trading instruments and market conditions.
When to explore it
The indicator is most effective in markets with clear trending or volatile conditions, where price and volume provide meaningful insights into market sentiment. It works well across different timeframes, making it suitable for scalping, day trading, and swing trading strategies.
Traders should use this indicator in conjunction with other technical analysis tools to confirm signals and develop a comprehensive trading approach. It is particularly useful when trying to understand the relationship between price movement and trading volume in various market scenarios.
Keep exploring
What we’ve verified
Access, alerts and repainting behaviour have not been independently verified for this indicator. Check the creator’s current publication and settings.
General descriptions and classifications are recovered research. Verified details above identify the specific checks we have completed. Check the creator’s current publication for later changes.