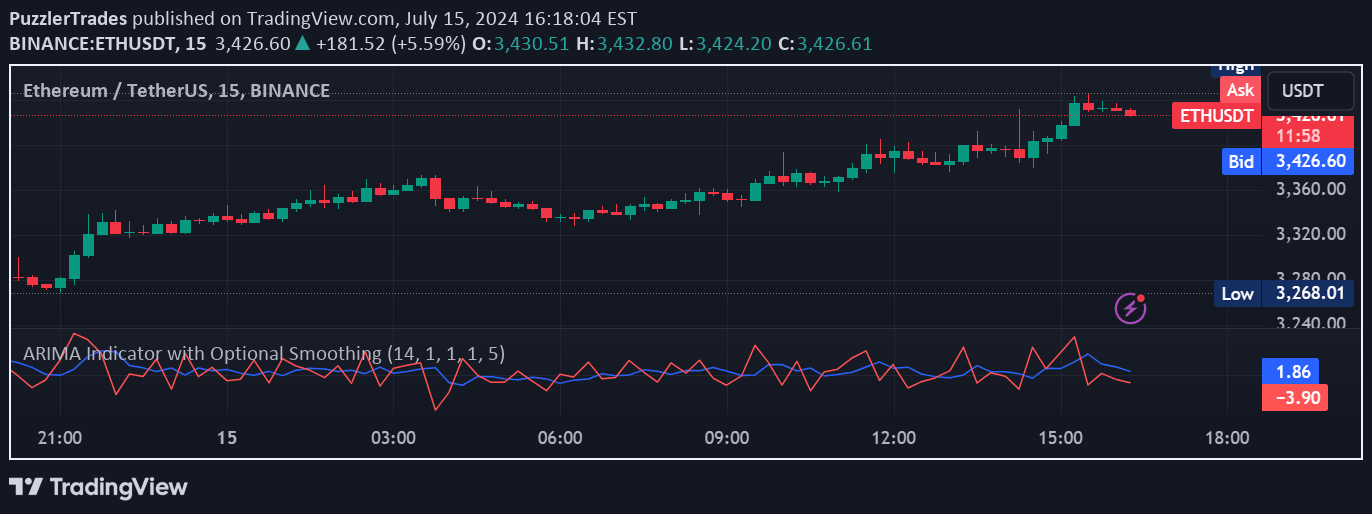
A hybrid exponential smoothing method that applies smoothing to data, residuals, and forecast errors for advanced time series analysis and prediction.
Explore complementary indicator rolesHow it works
The Hybrid Triple Exponential Smoothing (HTES) method works by applying exponential smoothing in three distinct stages: first to the raw data itself, then to the residuals from initial fitted values, and finally to one-point forecast errors. This approach creates a sophisticated smoothing technique that captures multiple layers of data complexity.
By using separate smoothing parameters for each stage and incorporating techniques like power transformations and error normalization, the method provides a flexible and computationally efficient way to analyze time series data. The algorithm operates with O(1) complexity, making it suitable for high-frequency streaming data processing.
Why it may be useful
The HTES method offers traders a powerful tool for understanding and predicting time series behavior with minimal computational overhead. By decomposing data into different components and smoothing them separately, traders can gain insights into underlying trends, seasonal variations, and potential forecast errors.
Unlike traditional smoothing techniques, this hybrid approach provides more nuanced analysis without requiring complex retraining or optimization processes. It allows for dynamic parameter selection and can be adapted to various trading contexts, from short-term scalping to longer-term swing trading strategies.
When to explore it
The Hybrid Triple Exponential Smoothing is most effective when dealing with complex, non-stationary time series data that exhibit trending and potentially seasonal characteristics. It is particularly useful for traders seeking to generate forecasts, develop trading signals, or create prediction intervals with minimal computational complexity.
Traders can leverage this method in scenarios such as detrending time series, generating equity curve simulations, performing nowcasting, or analyzing noisy trending data. Its flexibility allows adaptation to different market conditions and trading timeframes, from high-frequency intraday trading to longer-term swing trading approaches.
Keep exploring
What we’ve verified
Access, alerts and repainting behaviour have not been independently verified for this indicator. Check the creator’s current publication and settings.
General descriptions and classifications are recovered research. Verified details above identify the specific checks we have completed. Check the creator’s current publication for later changes.