Hull Suite
Hull Moving Average (HMA) is an advanced technical indicator designed to minimize lag and provide smooth trend visualization across multiple variants with customizable settings.
Explore 11,183 indicators. Filter beyond the obvious.
Discover the tools that fit the way you trade.
11,183 tools to explore
Hull Moving Average (HMA) is an advanced technical indicator designed to minimize lag and provide smooth trend visualization across multiple variants with customizable settings.
An experimental trading signal applying the Logistic Map Equation to popular indicators like Awesome Oscillator, ROC, RSI, and Stochastic to generate unique market insights through iterative mathematical calculations.
A multi-harmonic trigonometric model that extrapolates price trends using Fourier series and Quinn-Fernandes algorithm for predicting future price movements and cycles.
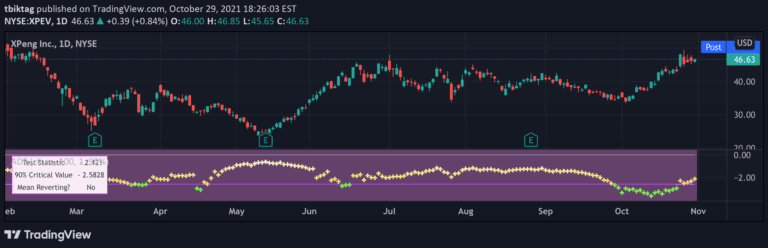
The Augmented Dickey-Fuller test statistically evaluates mean reversion in price series by analyzing the tendency of prices to return to an average level over time.
An indicator that automatically marks prior day and pre-market high and low levels across the entire trading session, helping traders identify key price reference points.
OTT is a versatile trend-following indicator that tracks price movements using a sophisticated mathematical construct, offering multiple adaptable systems for trend detection and signal generation.
A Pine Script visualization technique that displays multiple moving averages in a 3D format using linefill.new(), allowing customizable MA types, lengths, and color schemes.
A sophisticated signal processing technique that identifies dominant market cycles by applying linear predictive filters to price data, helping traders adapt strategies to changing market conditions.
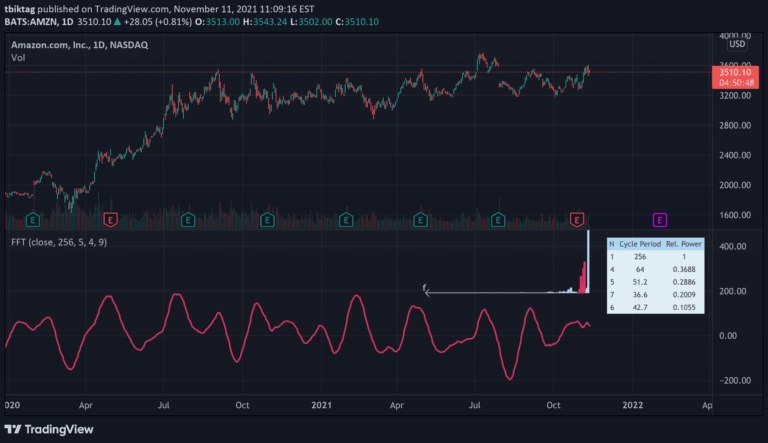
A Fast Fourier Transform (FFT) algorithm that decomposes time series data into cyclical frequency components, enabling advanced time series filtering and analysis.
Advanced trading signal that calculates precise intersection points between two data series, offering detailed insights into potential trend changes and crossover events.
A sophisticated MACD variant using Gaussian filters to enhance trend identification and reduce market noise, providing clearer momentum signals for traders.
A comprehensive trading indicator tracking price reactions across 16 timeframes, identifying fair value gaps, mitigation zones, session levels, and potential liquidity points of interest.
Likes, views, and comments are historical TradingView snapshots. They describe attention, not trading performance.