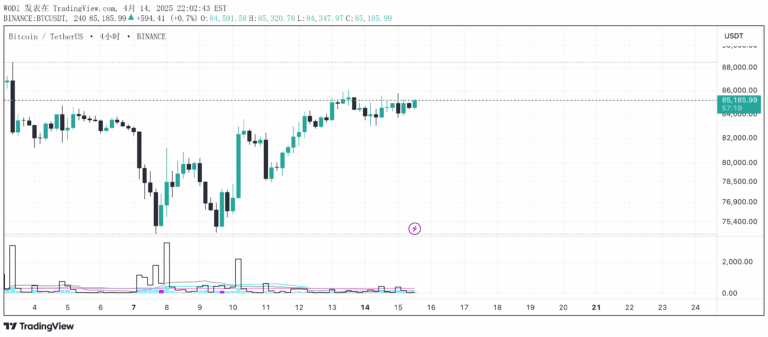
The IV Rank Oscillator measures market volatility by calculating historical volatility and normalizing it to show relative volatility levels across different market conditions.
Explore complementary indicator rolesHow it works
The IV Rank Oscillator calculates historical volatility by measuring the standard deviation of logarithmic returns over a specified period, typically 20 periods. It then normalizes this volatility by comparing it to the highest and lowest volatility levels observed over the past 252 trading periods, which represents approximately one year of market data.
The resulting IV Rank is plotted on a scale from 0 to 100, with reference lines at 20 (oversold), 50 (midline), and 80 (overbought). This visualization allows traders to quickly understand the current volatility environment relative to its historical context, providing insights into market conditions and potential trading opportunities.
Why it may be useful
The IV Rank Oscillator is crucial for traders because it provides a standardized method of understanding market volatility beyond simple price movement. By quantifying volatility relative to historical ranges, traders can make more informed decisions about potential market conditions and risk levels.
This indicator is particularly valuable for options traders and those implementing volatility-based strategies, as it offers a clear, visual representation of market uncertainty. The oscillator helps traders identify periods of high and low volatility, which can signal potential entry and exit points, risk management opportunities, and the potential effectiveness of different trading strategies.
When to explore it
The IV Rank Oscillator is most effective during periods of changing market dynamics when understanding volatility shifts becomes critical for trading decisions. Traders can use it to identify potential trend changes, assess market sentiment, and gauge the potential for significant price movements.
It is particularly useful in options trading, where volatility plays a crucial role in pricing and strategy selection. Traders might consider selling options when the IV Rank is high, indicating potentially overpriced options, or look for opportunities during periods of low volatility when option premiums are reduced.
Keep exploring
What we’ve verified
Access, alerts and repainting behaviour have not been independently verified for this indicator. Check the creator’s current publication and settings.
General descriptions and classifications are recovered research. Verified details above identify the specific checks we have completed. Check the creator’s current publication for later changes.