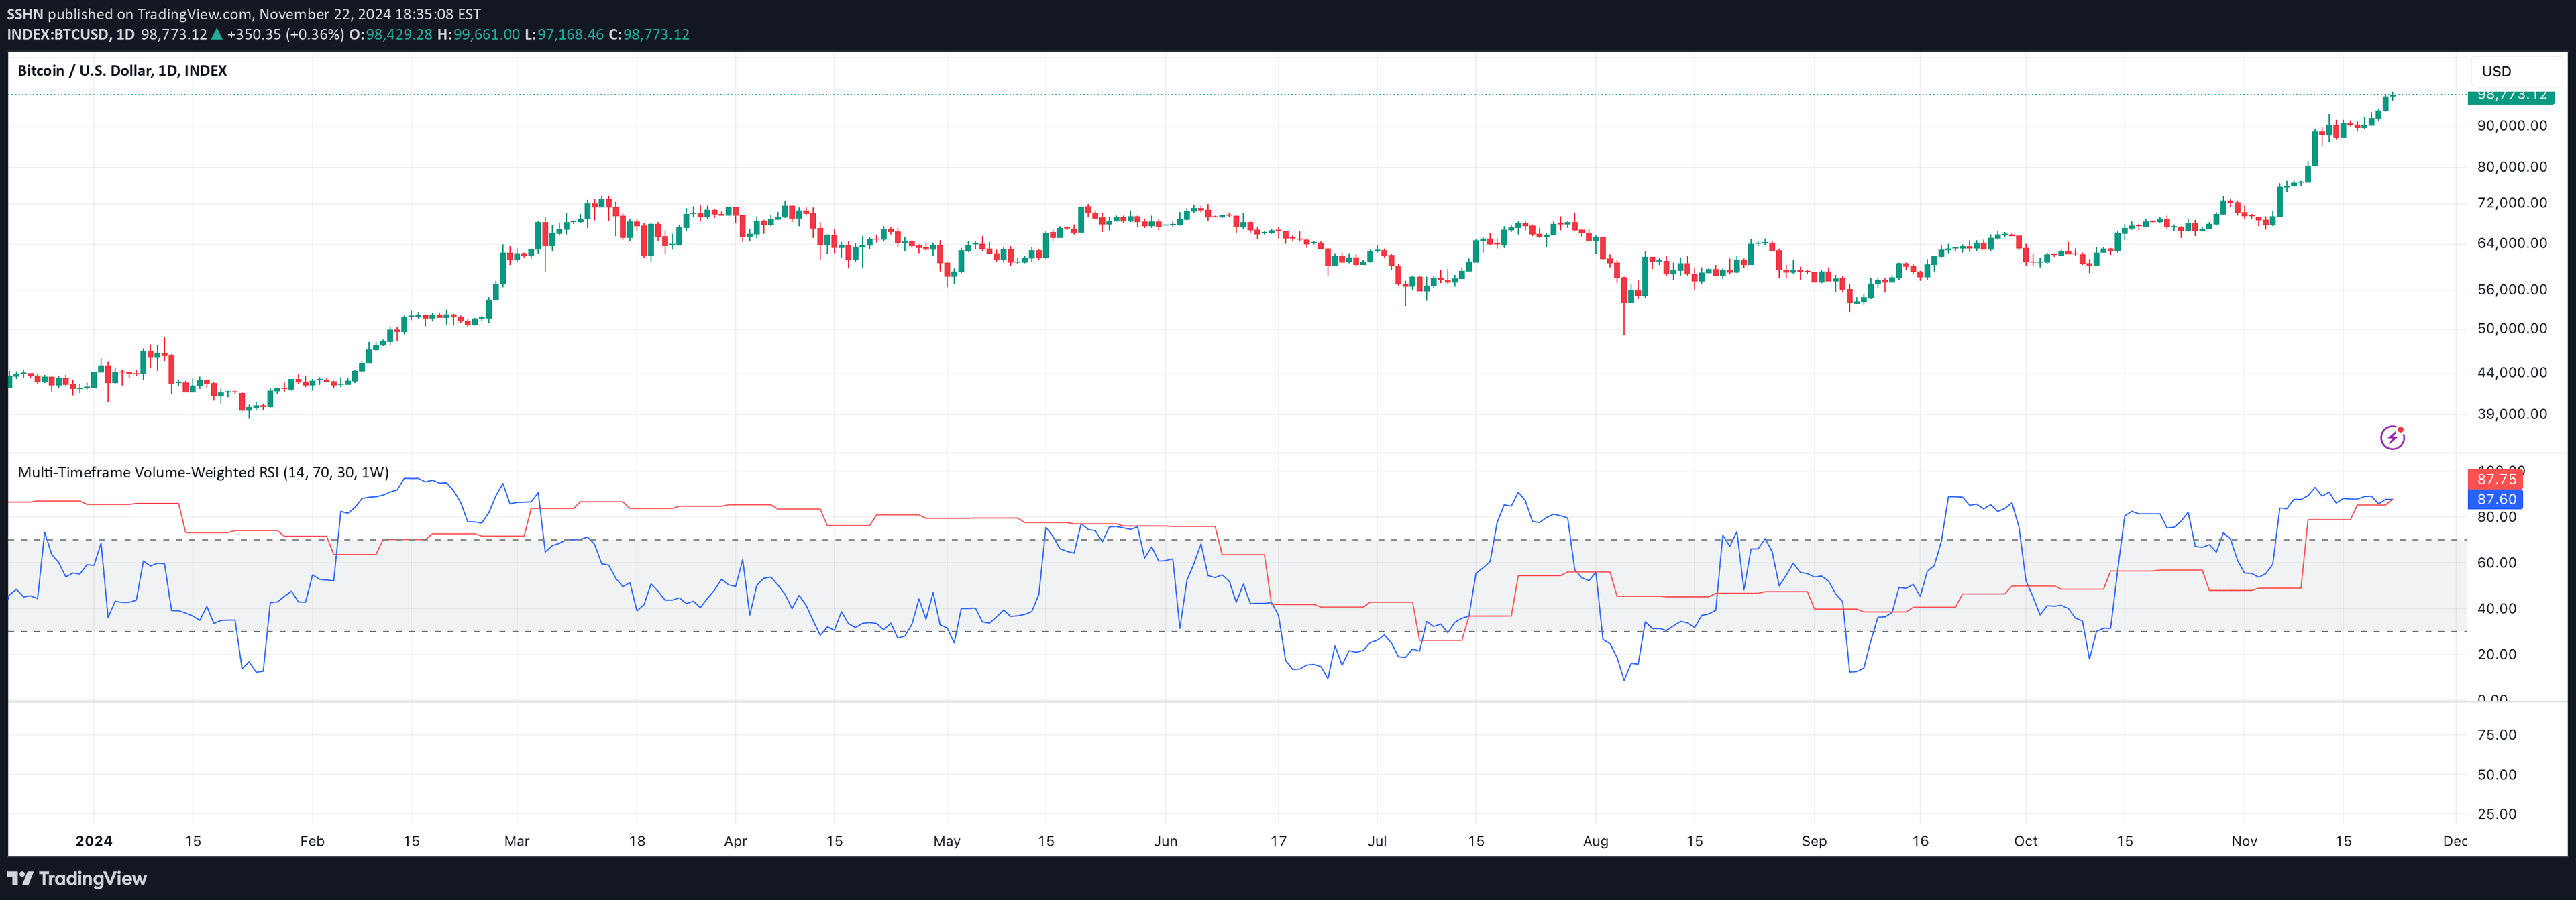
A visual percentile rank indicator that analyzes multiple data sources, ranking current candle performance against historical data and providing color-coded visual insights.
Explore complementary indicator rolesHow it works
The indicator calculates percentile ranks for selected data sources like volume, ATR, RSI, and other market metrics by comparing current values against historical data points. It assigns a percentage rank to each candle, showing where the current value sits relative to previous candles in the dataset.
Traders can select up to five different sources simultaneously, with customizable bottom and top percentage filters that change candle colors based on rank. When a candle's rank falls below the bottom percentage, it turns red, and when it rises above the top percentage, it turns green, providing instant visual feedback about market conditions.
Why it may be useful
This indicator helps traders quickly understand market dynamics by transforming complex numerical data into easy-to-interpret visual signals. By ranking current market metrics against historical performance, it provides context and comparative insights that might be difficult to discern through raw numbers alone.
The multi-source functionality allows traders to cross-reference different market indicators simultaneously, enhancing decision-making capabilities. Color-coded filters enable rapid identification of significant market movements, helping traders spot potential trading opportunities or warning signs more intuitively.
When to explore it
The percentile rank indicator works best in markets with substantial historical data, allowing for more accurate and meaningful comparisons. It is particularly useful for traders seeking to understand relative market conditions across multiple metrics simultaneously, such as volume, momentum, and price action.
Ideal for active traders who want to quickly assess market strength, potential trend changes, and comparative performance across different market indicators. Most effective when used on timeframes with sufficient historical context and when combining multiple data sources to create a comprehensive market analysis.
Keep exploring
What we’ve verified
Access, alerts and repainting behaviour have not been independently verified for this indicator. Check the creator’s current publication and settings.
General descriptions and classifications are recovered research. Verified details above identify the specific checks we have completed. Check the creator’s current publication for later changes.