Gaps Trend [ChartPrime]
A trading indicator that detects Fair Value Gaps (FVGs) to identify price momentum, providing dynamic trailing stops and trend direction visualization for traders.
Explore 11,183 indicators. Filter beyond the obvious.
Discover the tools that fit the way you trade.
11,183 tools to explore
A trading indicator that detects Fair Value Gaps (FVGs) to identify price momentum, providing dynamic trailing stops and trend direction visualization for traders.
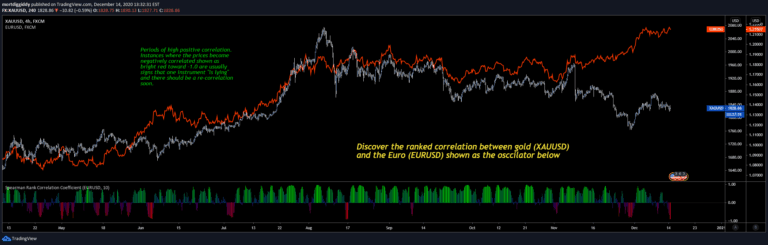
Spearman rank correlation coefficient measures the relationship between two variables by analyzing how they increase or decrease together, revealing potential market synchronization patterns.
A sophisticated technical analysis tool using Arnaud Legoux Moving Average to identify market trends, smooth price data, and provide dynamic trend insights with visual enhancements.
A dynamic momentum indicator using percentile analysis and ATR to detect significant market trends, providing clear long and short signals based on recent price action and volatility.
Advanced multi-signal trading tool combining power candle detection, breakout identification, and smart volatility-based risk placement for precision market analysis.
The Echo System is a comprehensive trading strategy that combines trend analysis, momentum detection, and candlestick validation to generate high-probability trading signals across multiple market conditions.
A comprehensive options volatility analysis tool that evaluates market conditions through historical volatility metrics, benchmarking, and regime detection to guide strategic options trading decisions.
An advanced support and resistance indicator that identifies key price levels using pivot points, volume, and strength metrics to help traders recognize potential market reversals and consolidation zones.
A detailed intrabar analysis technique using boxplot methodology to reveal hidden price activity, volume distribution, and potential support/resistance zones within trading timeframes.
An adaptive moving average crossover indicator that dynamically selects the most effective MA period by backtesting and ranking performance in real-time for precise trading signals.
A statistical method measuring non-linear correlation between two market variables like volume and trend, using Chatterjee Correlation Coefficient to understand potential relationships.
A volatility indicator measuring price range percentage across multiple time zones, helping traders identify potential low volatility periods and potential trend beginnings.
Likes, views, and comments are historical TradingView snapshots. They describe attention, not trading performance.