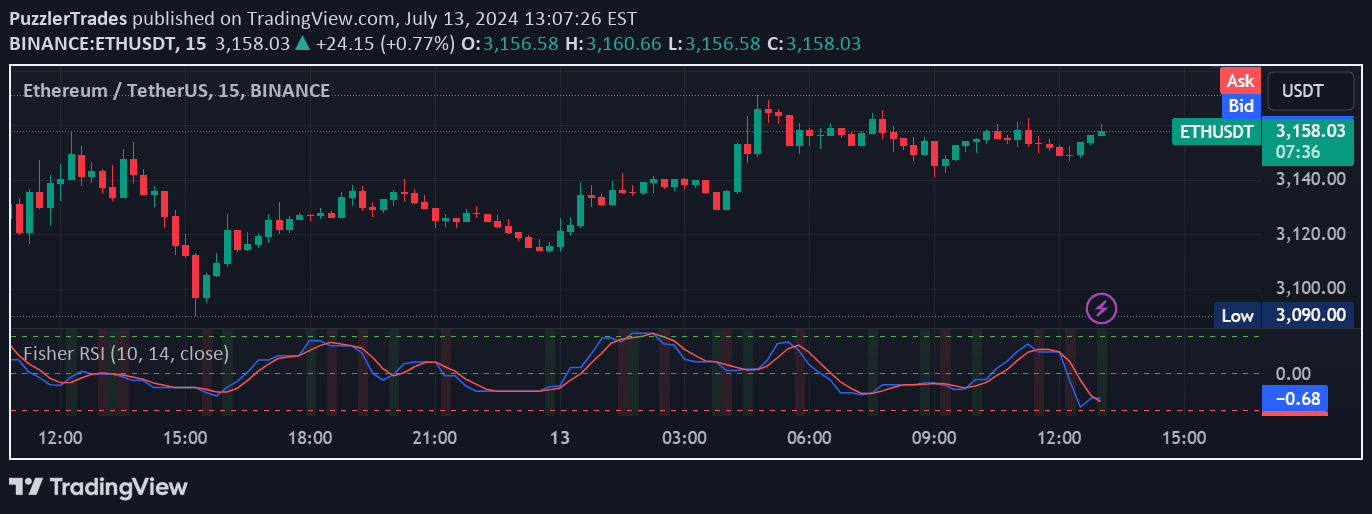
RSI is a momentum oscillator measuring price movement speed on a 0-100 scale, helping traders identify overbought or oversold conditions and potential market reversals.
Explore complementary indicator rolesHow it works
The Relative Strength Index (RSI) calculates momentum by comparing upward and downward price movements over a specific timeframe, typically 14 periods. It plots the results on a scale from 0 to 100, where values above 70 suggest an overbought condition and values below 30 indicate an oversold scenario.
RSI tracks price changes and measures the magnitude of recent price fluctuations, generating a single line that oscillates within the designated range. Traders use this line to identify potential trend reversals, momentum shifts, and divergence patterns between price action and the indicator's movement.
Why it may be useful
The RSI provides traders with a powerful tool to assess market momentum and identify potential trend reversals before they occur. By measuring the speed and magnitude of price changes, it offers insights into market psychology and potential turning points that might not be immediately visible on a price chart.
Understanding RSI helps traders make more informed decisions about market entry and exit points, reducing the risk of trading against the prevailing market momentum. Its ability to highlight overbought and oversold conditions enables traders to anticipate potential price corrections and adjust their strategies accordingly.
When to explore it
RSI works best in trending markets with clear directional movement, where momentum shifts can be more reliably predicted. Traders should use RSI in conjunction with other technical indicators to confirm signals and avoid false readings, particularly in highly volatile or ranging market conditions.
The indicator is most effective when applied to liquid markets with consistent price movements, such as major currency pairs, stock indices, and heavily traded commodities. Traders should also consider using multiple timeframes to validate RSI signals and improve the accuracy of their trading decisions.
Keep exploring
What we’ve verified
Access, alerts and repainting behaviour have not been independently verified for this indicator. Check the creator’s current publication and settings.
General descriptions and classifications are recovered research. Verified details above identify the specific checks we have completed. Check the creator’s current publication for later changes.