Engulfing pullback
A trading strategy identifying price pullbacks on moving averages combined with engulfing candlestick patterns to generate potential buy and sell signals for trend reversals.
Explore 11,183 indicators. Filter beyond the obvious.
Discover the tools that fit the way you trade.
11,183 tools to explore
A trading strategy identifying price pullbacks on moving averages combined with engulfing candlestick patterns to generate potential buy and sell signals for trend reversals.
An earnings gap analysis tool that identifies three types of stock price jumps after earnings reports, marking key price levels and tracking potential outperformance windows.
A comprehensive swing trading indicator that provides adaptive moving averages, price contraction detection, resistance line tracking, and detailed trading information across multiple timeframes.
A custom indicator that dynamically draws trend lines using tangent angles, offering unique insights into market momentum and potential price movement based on geometric principles.
Lyapunov Market Instability uses chaos theory to analyze market dynamics, revealing whether markets are trending or ranging by measuring trajectory divergence and regime changes.
A trading indicator that identifies Fair Value Gaps by analyzing three consecutive candles to detect price imbalances and potential trading opportunities across different market conditions.
A price gap detection indicator that highlights significant price movements between trading sessions, helping traders identify potential support, resistance, and breakout opportunities.
A trading indicator that visually highlights price gaps between bars, helping traders identify price jumps and potential trading opportunities across different timeframes.
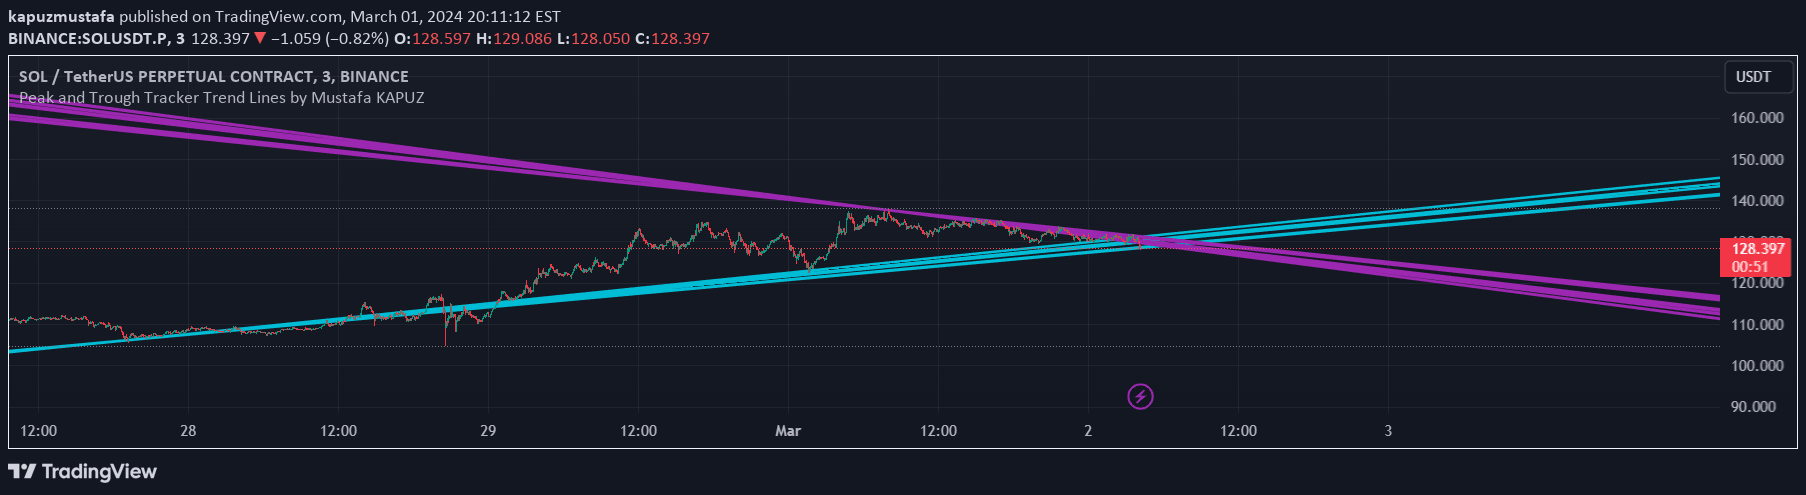
A visual trading tool that tracks peak and trough prices across two time periods, drawing lines to highlight potential support and resistance levels in market movements.
A real-time market cap indicator for the APU token that calculates current valuation by multiplying price and circulating supply, providing instant market insights.
A visual indicator that identifies tight back-to-back candles in an uptrend, helping traders spot potential continuation patterns with precise close value comparisons.
A custom Renko chart overlay that adapts brick size dynamically, providing a unique visualization of price movements with enhanced trend clarity and noise reduction.
Likes, views, and comments are historical TradingView snapshots. They describe attention, not trading performance.