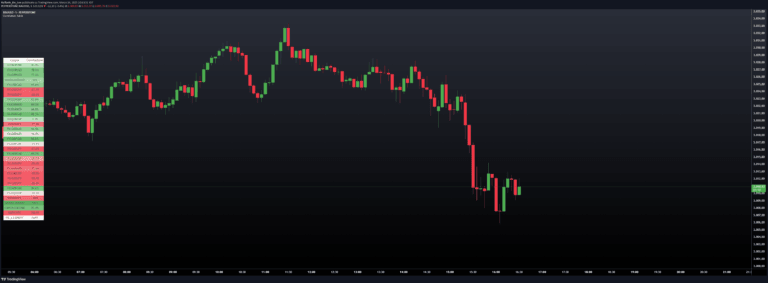
Historical Correlation [LuxAlgo]
Historical Correlation tool calculates correlation coefficients between assets, revealing how different financial instruments move in relation to each other over time.
Explore 11,183 indicators. Filter beyond the obvious.
Discover the tools that fit the way you trade.
11,183 tools to explore
Historical Correlation tool calculates correlation coefficients between assets, revealing how different financial instruments move in relation to each other over time.
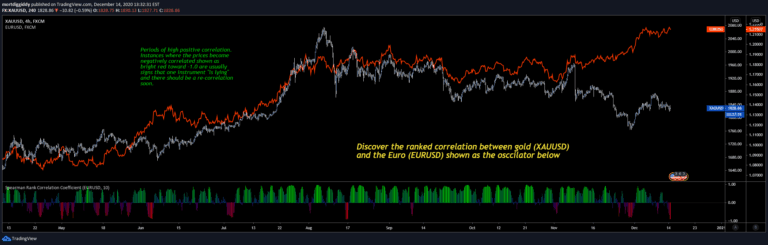
Spearman rank correlation coefficient measures the relationship between two variables by analyzing how they increase or decrease together, revealing potential market synchronization patterns.
A cross-correlation script that analyzes lead-lag relationships between multiple financial assets by calculating normalized correlation values across different time lags.
Correlation Tracker analyzes the relationship between two trading symbols, calculating their correlation strength and providing visual insights into their price movement interactions.
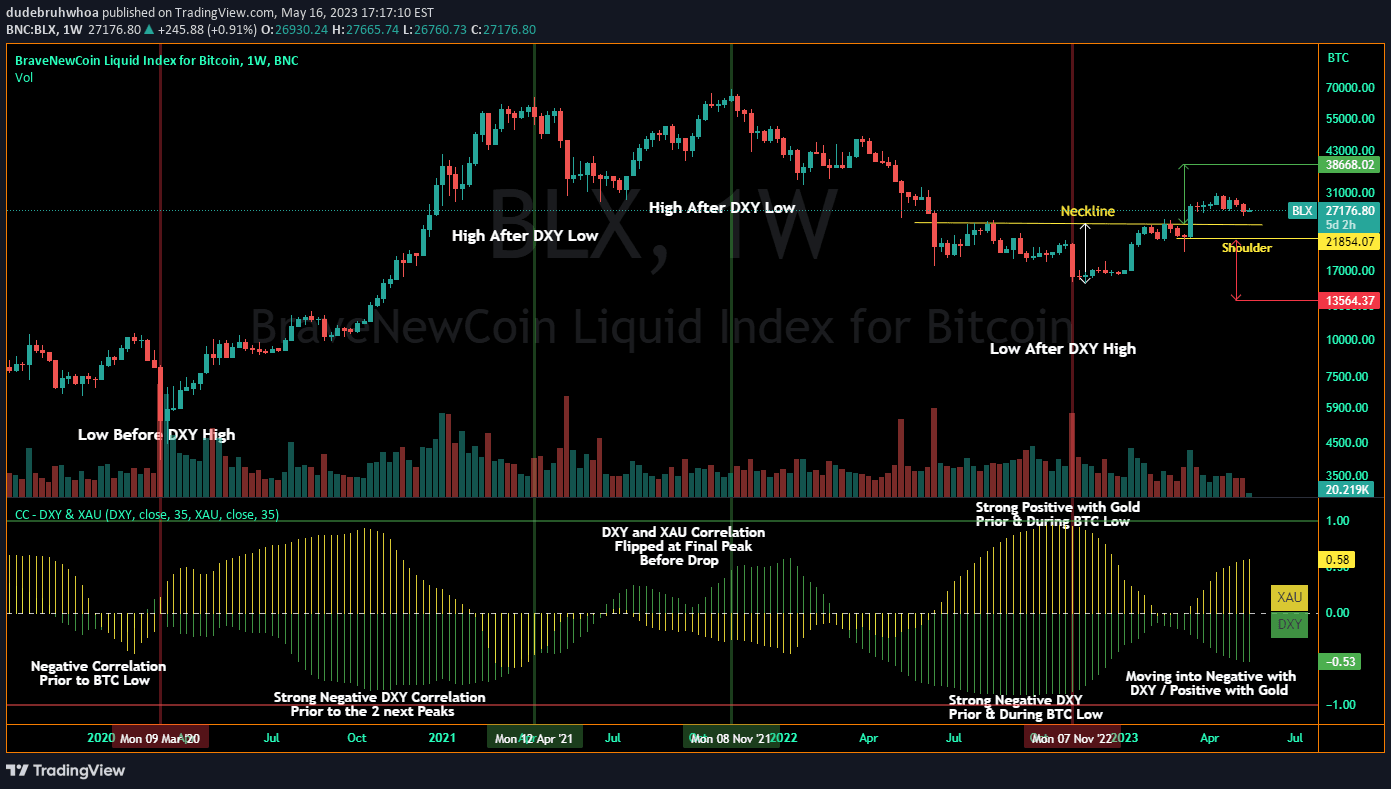
A custom correlation coefficient indicator comparing Bitcoin's price movements with DXY and Gold, helping traders anticipate potential market direction by analyzing inter-asset relationships.
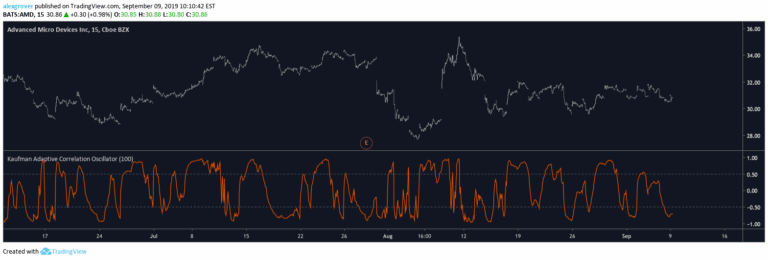
An adaptive correlation oscillator that measures linear relationships between market closing prices and a simple increasing line, using Kaufman adaptive moving average for smoother signal generation.
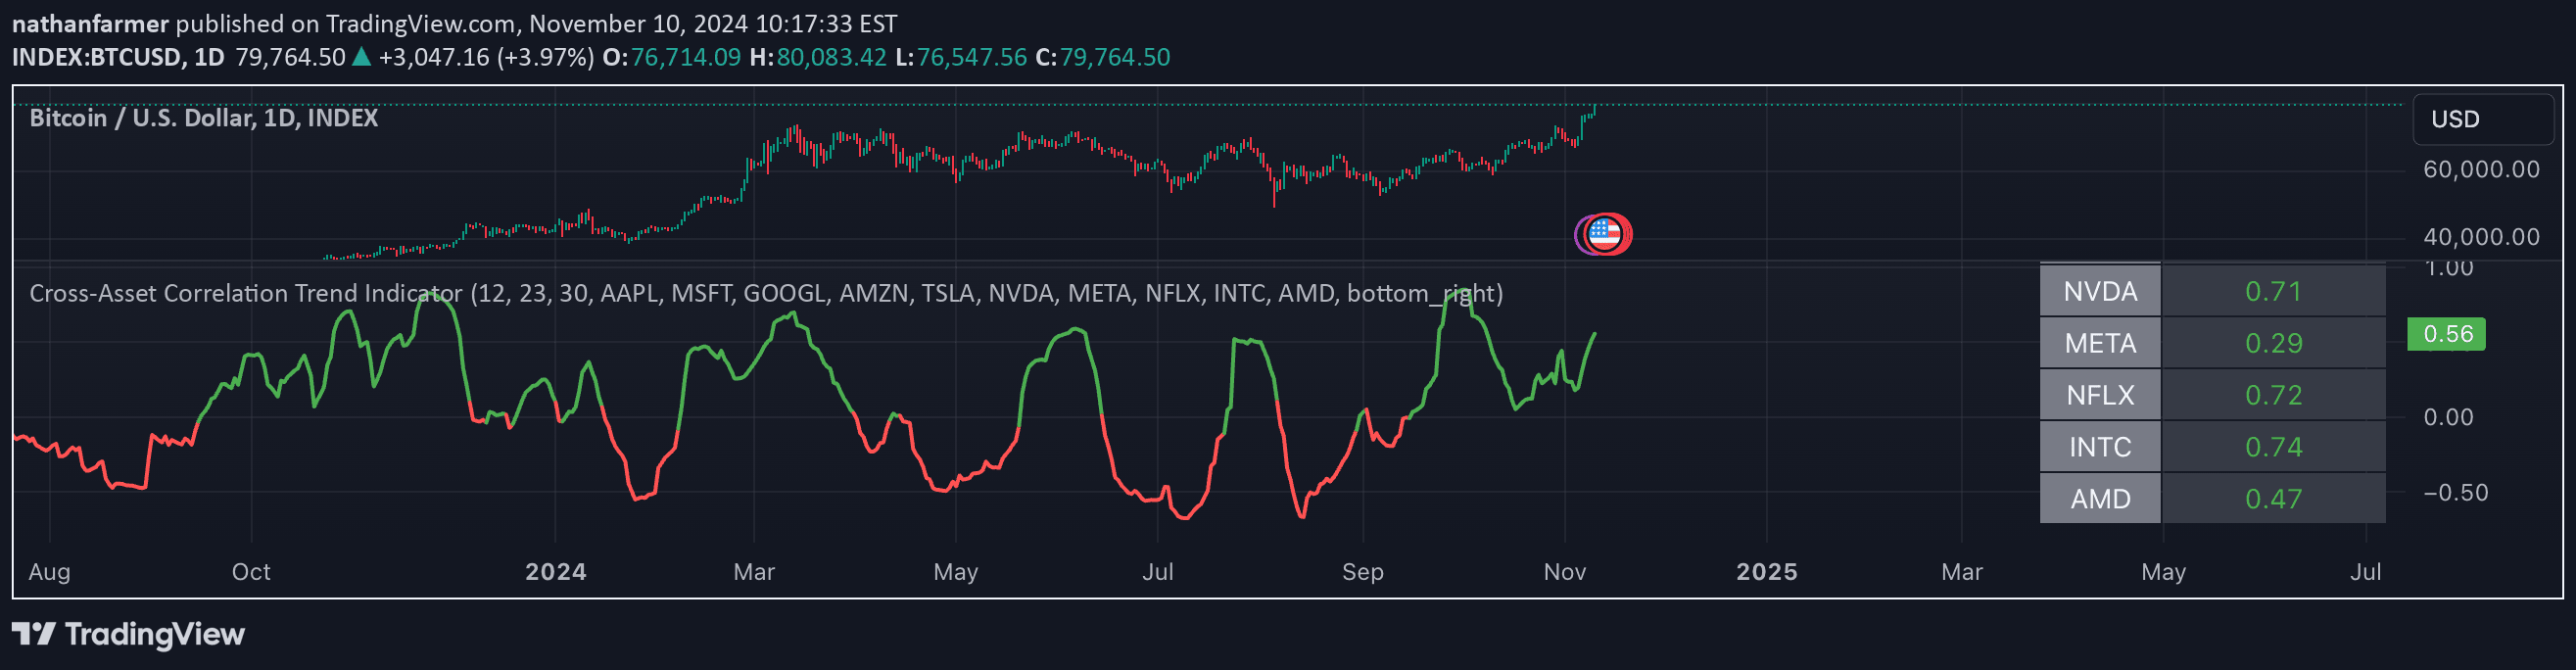
A cross-asset correlation trend indicator that analyzes multiple asset trends and their relationships to predict an average trend signal for the main charted asset.
A correlation coefficient indicator that compares price movements between different symbols, helping traders understand relationship and potential synchronized market behavior across multiple assets.
A comprehensive correlation indicator that compares an asset's price movement with up to 32 other trading pairs, offering visual insights into market relationships and potential trading opportunities.
A multi-timeframe correlation indicator that measures relationship between two financial assets across different time periods, revealing how assets move relative to each other.
A correlation-based indicator that visualizes price relationship with multiple moving averages to help traders identify market trends and potential trend shifts across different timeframes.
The Correlation Coefficient (CC) measures statistical relationship between two securities, revealing how they move relative to each other through a scale from -100 to +100.
Likes, views, and comments are historical TradingView snapshots. They describe attention, not trading performance.