SuperTrend AI (Clustering) [LuxAlgo]
SuperTrend AI is an advanced machine learning technique that applies K-means clustering to the SuperTrend indicator, dynamically adapting trailing stop settings based on performance metrics.
Explore 11,183 indicators. Filter beyond the obvious.
Discover the tools that fit the way you trade.
11,183 tools to explore
SuperTrend AI is an advanced machine learning technique that applies K-means clustering to the SuperTrend indicator, dynamically adapting trailing stop settings based on performance metrics.
SuperBollingerTrend combines Bollinger Bands and SuperTrend to analyze market volatility and trend direction, providing traders insights into potential trend changes and breakouts.
A sophisticated trend indicator that uses triple smoothing to filter market noise and identify potential trend directions through moving average crossovers and dynamic color visualization.
A comprehensive trend and strength indicator that uses moving averages and standard deviation to identify market trends, providing color-coded signals and a dynamic strength gauge for traders.
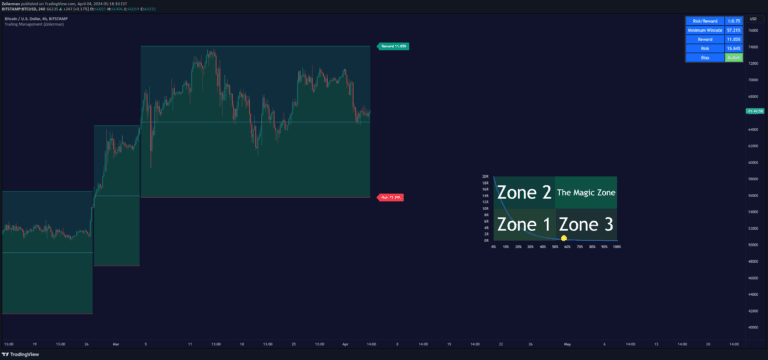
An advanced trading indicator that dynamically manages trailing stops, calculates break-even points, and helps traders optimize risk-reward strategies across different market conditions.
A script for quickly analyzing trading signals by computing performance metrics across different stop-loss and take-profit configurations using SuperTrend signals.
The Corrected Moving Average (CMA) is an adaptive moving average system designed to minimize false signals in sideways markets and provide more accurate trend identification across different market conditions.
A sophisticated trend analysis tool using Gaussian filtering to detect market trends, volatility, and potential reversals with dynamic bands and strength indicators.
A hybrid indicator combining half-trend methodology with Heikin Ashi candles to detect market trends, reversals, and measure trend strength through advanced price analysis.
A comprehensive trend strength indicator combining RSI, Supertrend, and EMA Cross to provide dynamic trend detection and visualization with customizable settings.
A dynamic trade management tool using Average True Range to visualize and manage trade entry, stop loss, and take profit levels with unique curved visualizations.
Linear Regression Intensity is an advanced trend analysis tool that measures market trend strength using linear regression, offering dynamic color-coded insights into bullish, bearish, and neutral market conditions.
Likes, views, and comments are historical TradingView snapshots. They describe attention, not trading performance.