Previous Day High and Low + Separators Daily/Weekly
A technical indicator that highlights previous day's high and low points, uses daily and weekly separators to create a clean chart that helps traders understand potential market direction.
Explore 11,183 indicators. Filter beyond the obvious.
Discover the tools that fit the way you trade.
11,183 tools to explore
A technical indicator that highlights previous day's high and low points, uses daily and weekly separators to create a clean chart that helps traders understand potential market direction.
The Stochastic Momentum Index (SMI) is an advanced oscillator that measures price momentum by calculating the closing price's position relative to the high-low range.
A comprehensive trading session indicator that tracks global market hours across multiple time zones, helping traders identify optimal trading windows and manage time-sensitive strategies.
A Break of Structure (BOS) indicator using moving averages to identify early trend changes and potential trading opportunities, focusing on detecting swing highs and lows.
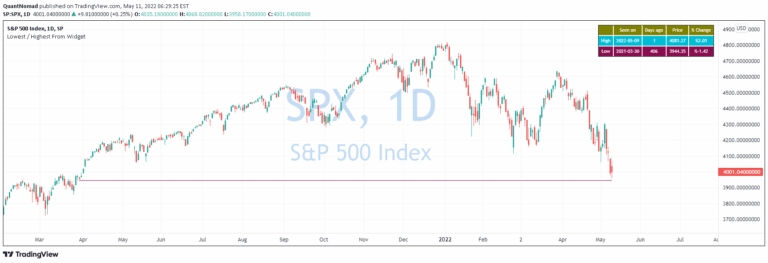
A widget that identifies the most recent day when price was higher or lower than the current value, visualizing historical price comparisons through lines and informative tables.
A dynamic trading indicator that plots previous day's min and max price levels with intermediate stop-loss zones, helping traders identify key support and resistance areas with customizable alerts.
A trading strategy focused on identifying panic selling and buying opportunities across multiple symbols, providing real-time alerts and visual signals for potential market reversals.
A combined trading signal that tracks opening range breakouts and daily/weekly pivot levels to identify potential trading opportunities based on price action around key market levels.
A trading indicator that plots high and low price levels across different futures trading sessions, helping traders identify key support and resistance zones for potential breakouts.
A market breadth indicator tracking cumulative 52-Week New Highs minus New Lows across different market indexes, with a customizable moving average for trend analysis.
A multi-timeframe indicator analyzing price highs and lows across different time periods, offering customizable visualization of market trends and key price levels.
A time-weighted price action indicator that detects consolidation zones and highlights potential reversal points using contrarian breakout logic to identify market traps.
Likes, views, and comments are historical TradingView snapshots. They describe attention, not trading performance.