OHLC [TFO]
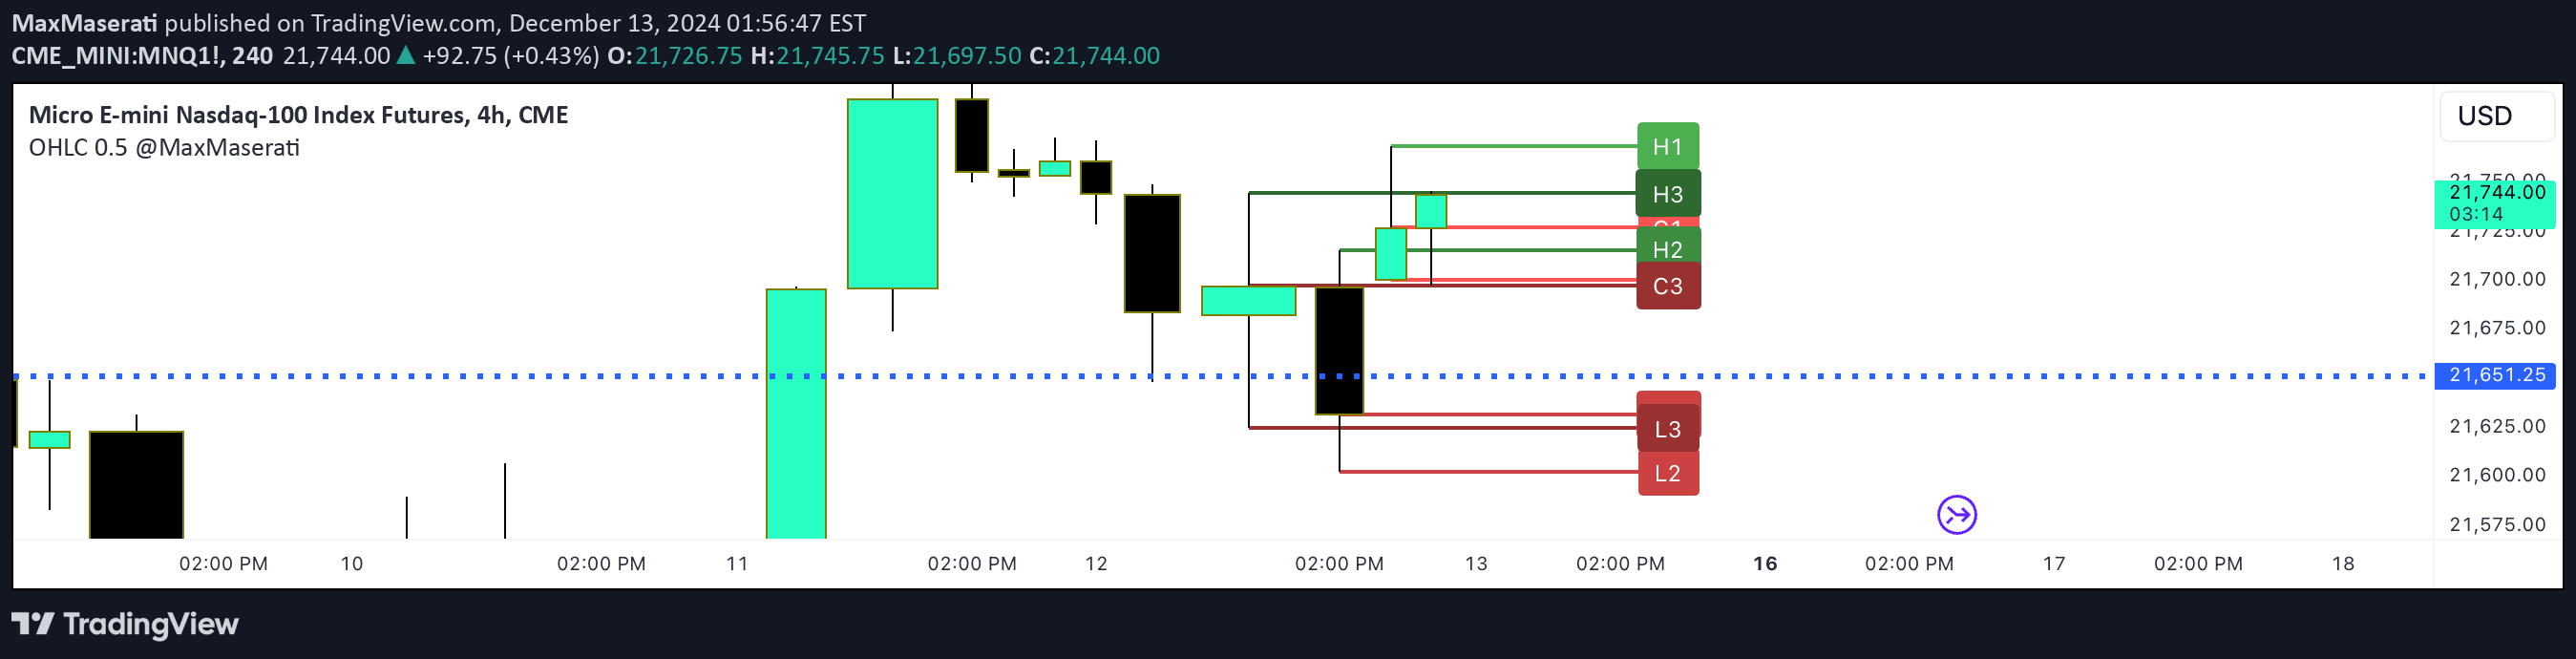
A trading approach focusing on higher timeframe OHLC analysis to understand market structure and potential directional movements using daily chart insights.
Explore 11,183 indicators. Filter beyond the obvious.
Discover the tools that fit the way you trade.
11,183 tools to explore
A trading approach focusing on higher timeframe OHLC analysis to understand market structure and potential directional movements using daily chart insights.
A highly configurable indicator that tracks previous key price levels across multiple timeframes, allowing traders to identify important support, resistance, and liquidity zones with customizable settings.
A custom trading indicator that tracks session-based OHLC statistics, analyzing price action within defined time ranges and calculating manipulation and distribution levels for strategic trading insights.
A versatile indicator that displays key trading levels with extensive customization options. Helps traders identify crucial price points and market structure with multiple display settings.
An advanced trading indicator that calculates price premium and discount zones using previous candle data, offering insights into potential entry and exit points for traders.
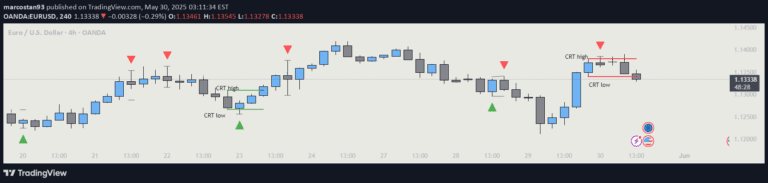
A trading indicator that identifies potential market reversals or continuations by analyzing two consecutive candle patterns and generating visual signals with triangular markers.
A custom indicator that identifies potential support and resistance levels using daily, weekly, and monthly price data to help traders visualize key market price zones.
A multi-pivot indicator that displays support and resistance levels using various pivot calculation methods and previous period price levels for comprehensive market analysis.
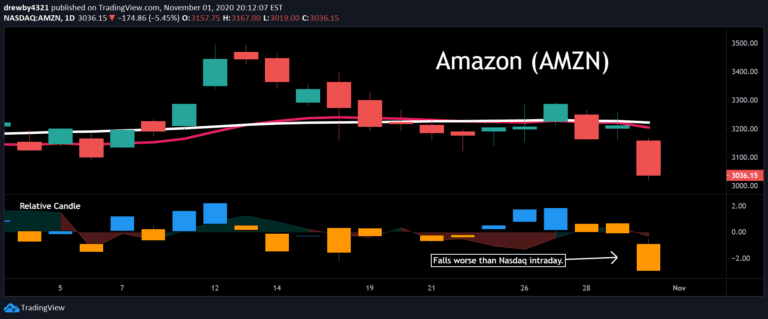
A visual indicator comparing a specific stock's daily performance against a market index, revealing relative price movements and potential anomalies in trading behavior.
Previous OHLC tracks the opening, high, low, and closing prices from the last trading period, providing key insights into market sentiment and potential price action.
A statistical OHLC projection tool that breaks down price movement into manipulation and distribution levels, helping traders understand potential market dynamics across different timeframes.
A multi-timeframe OHLC indicator that provides comprehensive price action visualization across different time periods with customizable display options for enhanced market analysis.
Likes, views, and comments are historical TradingView snapshots. They describe attention, not trading performance.