YOUR INDICATOR RESEARCH STARTS HERE

Find the right indicator.
Understand what it does.

Explore 11,183 indicators. Filter beyond the obvious.
Discover the tools that fit the way you trade.

THE INDICATOR LIBRARY

Results for “SUM”

11,183 tools to explore

101 indicators matching your filters
Save search
MomentumOscillatorSignal

RSI (Kernel Optimized) | Flux Charts

by fluxchart

A specialized RSI indicator using Kernel Density Estimation to predict potential pivot points by analyzing historical RSI patterns and calculating probability of price reversals.

Separate pane · unverifiedScalping · Day Trading
Explore
5.9Klikes98.1Kviews23comments
Save
TrendMomentumEditor’s pick

Rolling largest Impulse Murreys Lines

by RicardoSantos

A trading signal using Kadane's algorithm to identify the largest market impulse within a window, then applying Murrey's math lines to map potential price movements and trading opportunities.

Main price chart · unverifiedDay Trading · Swing Trading
Explore
3.6Klikes84.5Kviews64comments
Save
TrendMomentumEditor’s pick

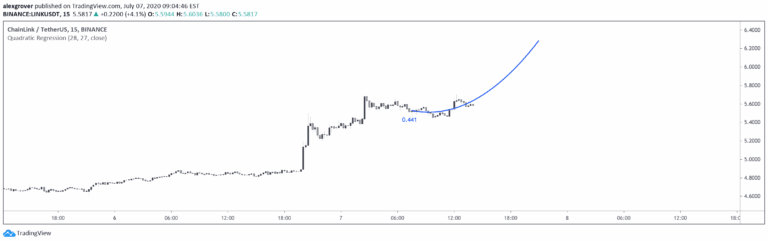
Quadratic Regression

by alexgrover

A quadratic regression indicator that fits a parabolic curve to price data, allowing traders to analyze non-linear trends and potentially forecast future price movements.

Main price chart · unverifiedDay Trading · Swing Trading
Explore
2.5Klikes45.8Kviews81comments
Save
MomentumOscillatorTrend

Enhanced McClellan Summation Index

by EliCobra

A comprehensive market breadth indicator combining McClellan Summation Index with Heikin-Ashi visualization and MACD analysis to provide advanced trend and momentum insights.

Separate pane · unverifiedDay Trading · Swing Trading
Explore
1.3Klikes19Kviews5comments
Save
TrendSignalOscillator

Stablecoin Supply Ratio Oscillator

by EliCobra

The Stablecoin Supply Ratio Oscillator analyzes market sentiment by comparing Bitcoin's market cap to stablecoin market caps, using z-score transformation to identify potential market turning points.

Separate pane · unverifiedDay Trading · Swing Trading
Explore
1.2Klikes16.7Kviews13comments
Save
VolumeTrendEditor’s pick

Intraday Intensity Modes

by allanster

Intraday Intensity Index analyzes trading volume and price dynamics to measure buying and selling pressure within a trading session, providing insights into market participant behavior.

Separate pane · unverifiedDay Trading
Explore
1.1Klikes47.7Kviews14comments
Save

Likes, views, and comments are historical TradingView snapshots. They describe attention, not trading performance.

START WITH A QUESTION

A little less searching.
A lot more understanding.

Tell DeepAlpha what you need. Get an explanation, a shortlist,
and a direct path to the indicators behind it.

Ask DeepAlpha