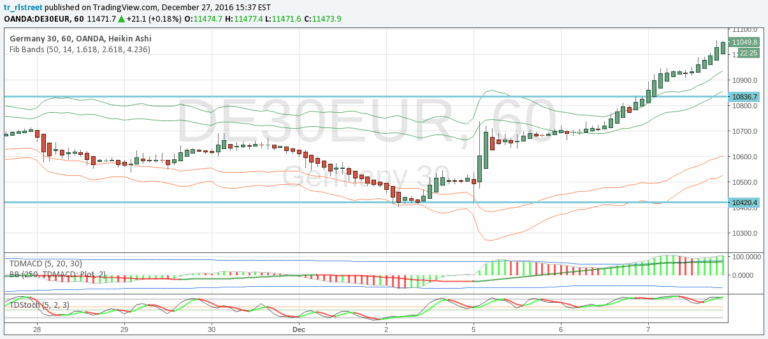
Momentum-based ZigZag (incl. QQE) NON-REPAINTING
A custom ZigZag indicator that identifies market reversals using momentum indicators, providing true pivot points without repainting and highlighting impulse strength.
Explore 11,183 indicators. Filter beyond the obvious.
Discover the tools that fit the way you trade.
11,183 tools to explore
A custom ZigZag indicator that identifies market reversals using momentum indicators, providing true pivot points without repainting and highlighting impulse strength.
A comprehensive trading toolkit that identifies critical market zones, institutional liquidity levels, and potential price movement patterns using advanced technical analysis techniques.
Fair value bands assess price behavior by tracking deviations from a mean basis, helping traders identify normal and abnormal price movements through dynamic statistical bands.
RSI Trail is a technical analysis tool that uses Relative Strength Index and moving averages to dynamically plot support and resistance levels, helping traders identify market trends and potential entry/exit points.
A Bollinger Bands upgrade using Nadaraya-Watson estimator to reduce noise and provide smoother price movement analysis with weighted kernel smoothing.
A Fibonacci-based trading signal using SMA bands to identify short-term reversals in market direction. Helps traders spot potential entry and exit points during ranging market conditions.
On-Balance Volume (OBV) is a technical analysis tool that aggregates trading volume to measure buying and selling pressure, helping traders identify potential trend reversals and market momentum.
A statistical tool analyzing price and volume variations across multiple symbols using Z-Score metrics to identify market trends, outliers, and potential trading opportunities.
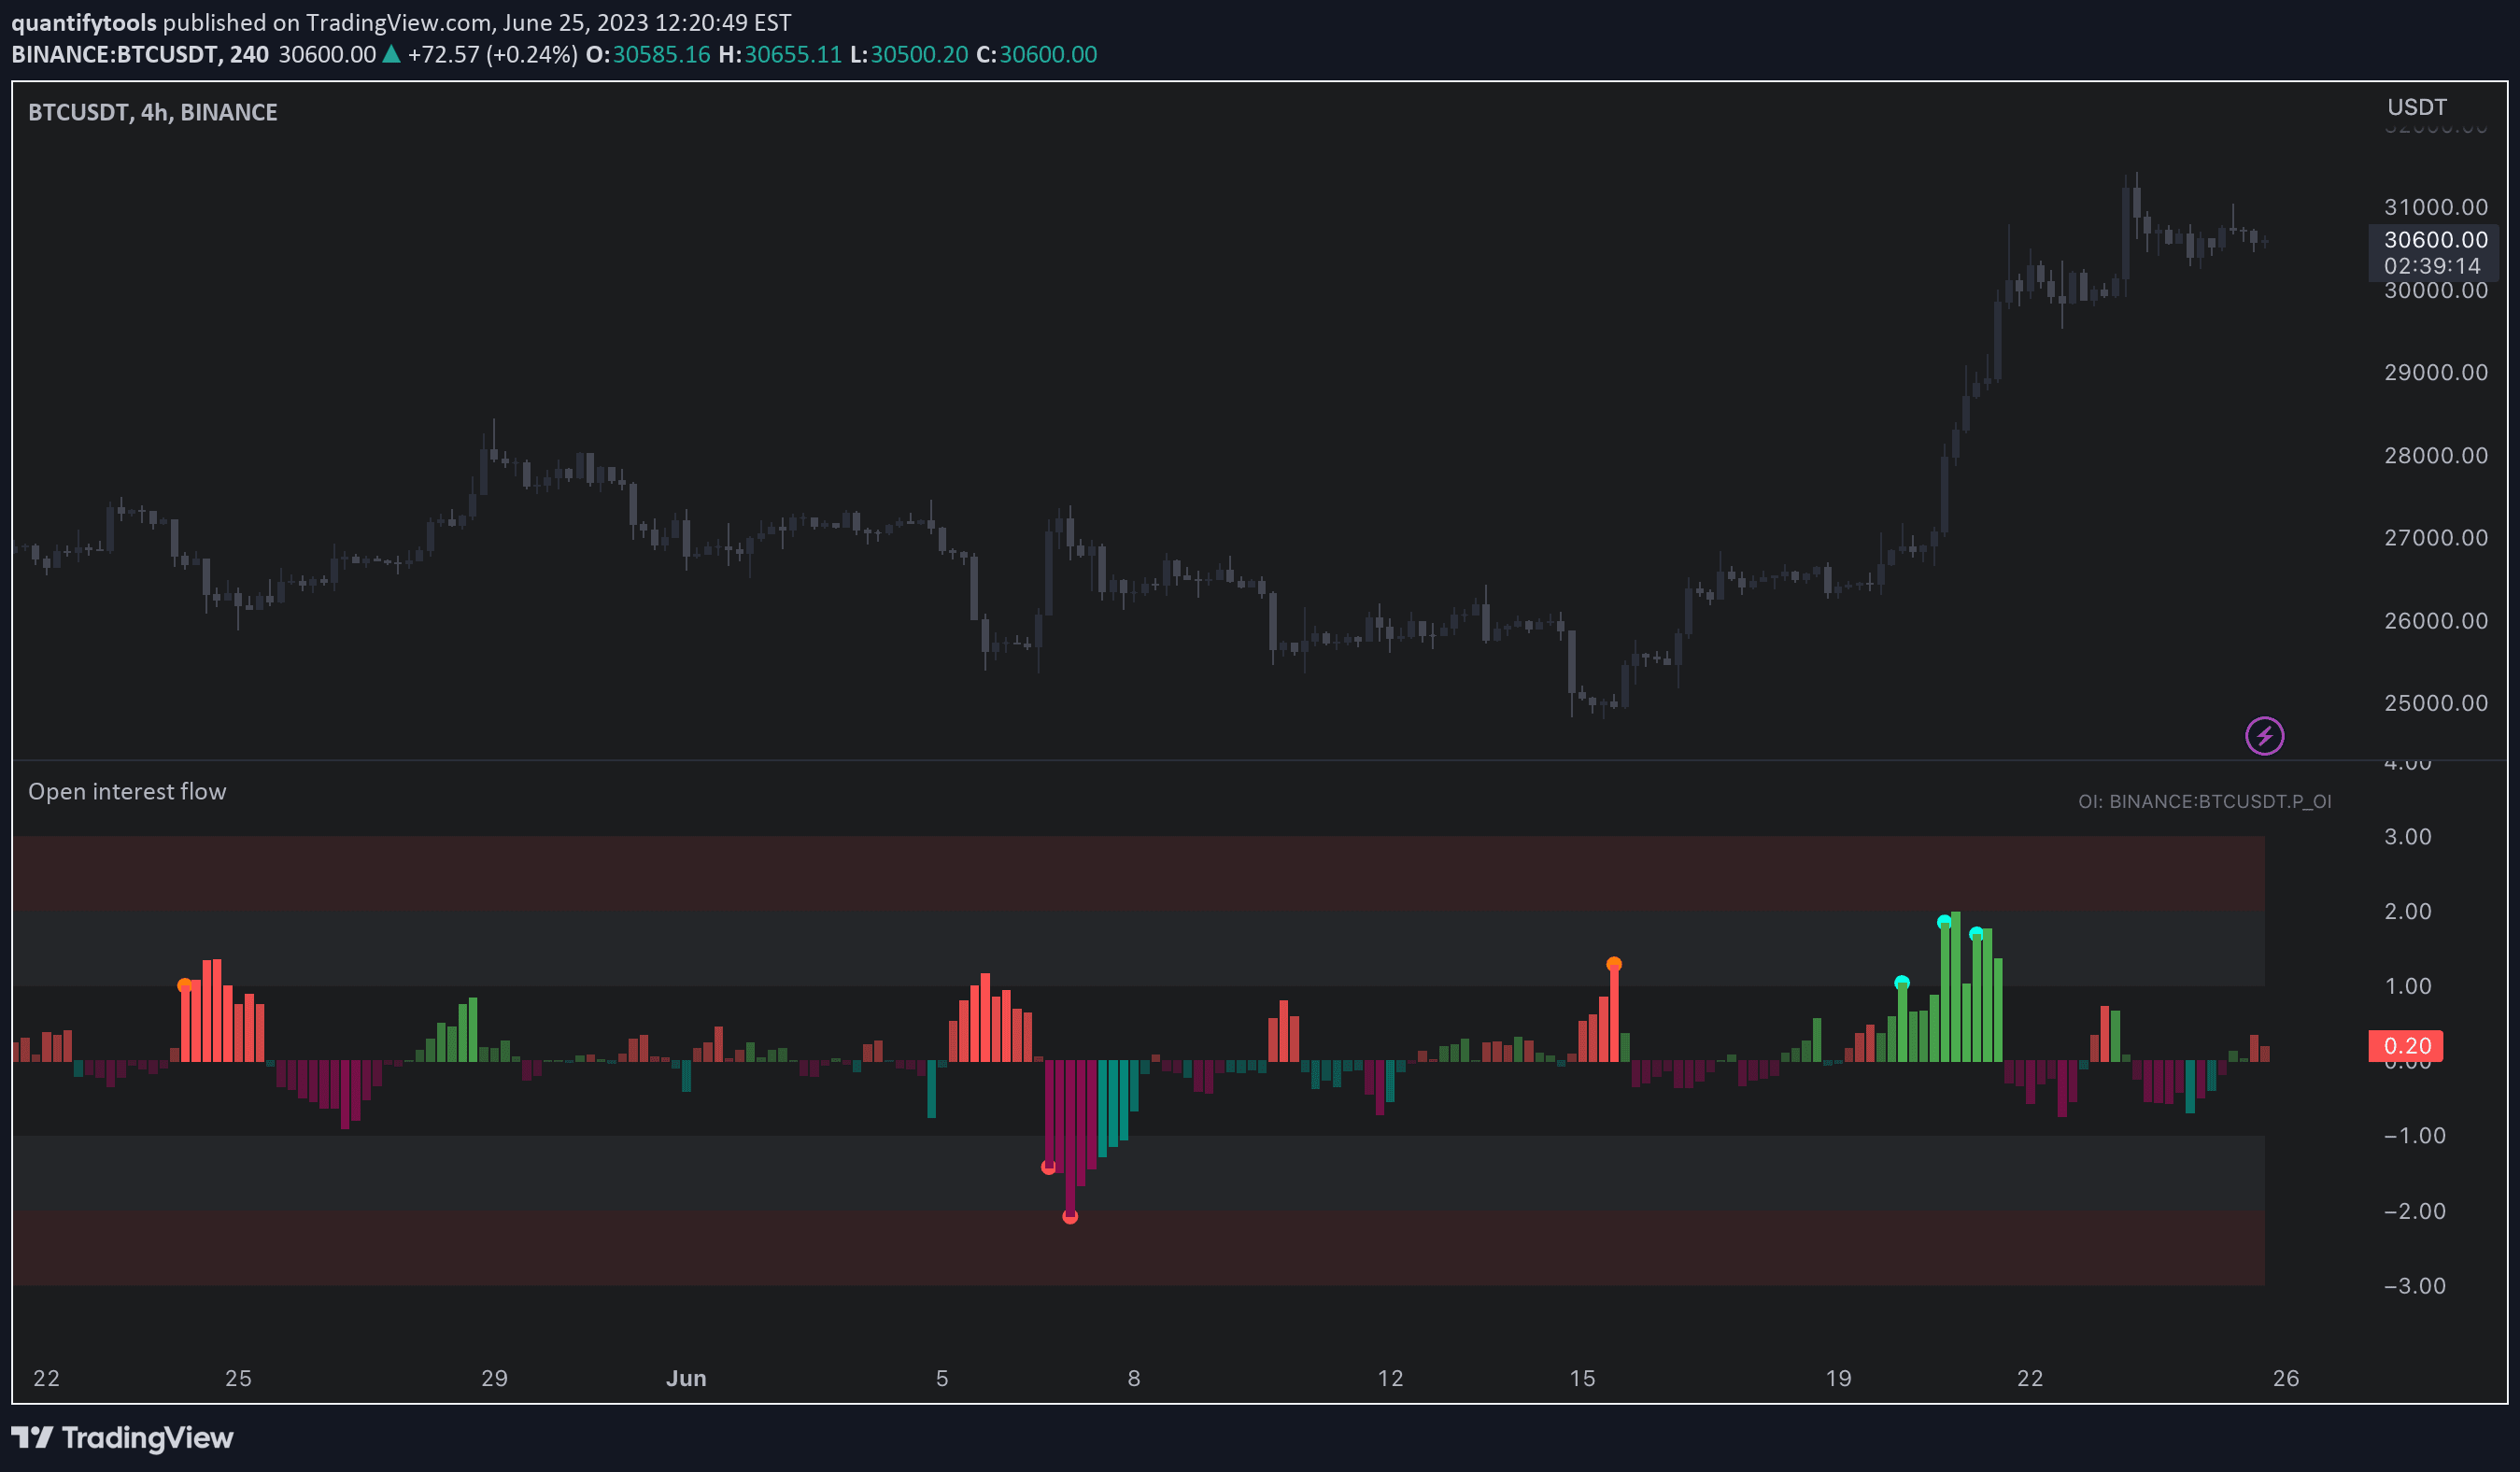
Open interest flow indicator detecting market sentiment by analyzing position openings and closings, revealing potential exuberance or liquidation moments in trading.
Relative Volume indicator measures trading volume compared to historical averages, helping traders identify significant market activity and potential trading opportunities across different timeframes.
Market Cipher B is an advanced trading tool integrating WaveTrend, RSI, and MoneyFlow indicators to provide comprehensive market analysis and signal detection.
A trading indicator that plots high/low levels for key trading sessions and identifies RTH opening gaps, providing potential entry and exit areas for traders.
Likes, views, and comments are historical TradingView snapshots. They describe attention, not trading performance.