Liquidity Grabs | Flux Charts
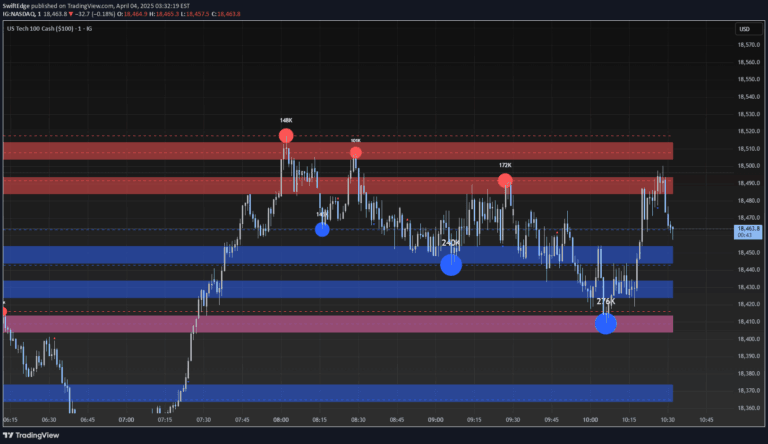
A liquidity grab indicator that highlights market order execution points by rendering unique bubbles on candles where significant liquidity areas are swept with large wicks.
Explore 11,183 indicators. Filter beyond the obvious.
Discover the tools that fit the way you trade.
11,183 tools to explore
A liquidity grab indicator that highlights market order execution points by rendering unique bubbles on candles where significant liquidity areas are swept with large wicks.
A visual volume indicator that represents trading volume as dynamic bubbles on price charts, providing intuitive insights into market activity and trading intensity.
A liquidity visualization tool that maps buy and sell-side zones using swing highs/lows and volume analysis, providing traders a color-coded heatmap of potential support and resistance levels.
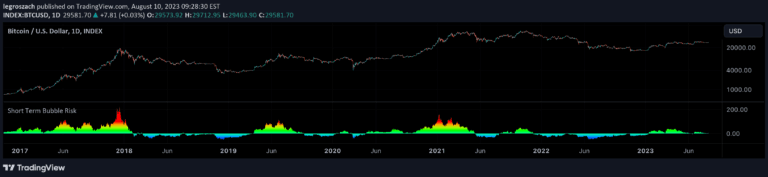
A weekly risk indicator for Bitcoin and Ethereum that measures price extension from the 20-week simple moving average, providing a color-coded risk oscillator to assess short-term market conditions.
A screener that identifies liquidity grabs across five tickers by detecting false breakouts and analyzing candle wick-to-body ratios to highlight potential trading opportunities.
A statistical regression analysis for Bitcoin trading that uses three price boundary lines to identify optimal buying and selling opportunities based on historical price data.
Network Value Transaction (NVT) Ratio assesses Bitcoin's network valuation by comparing market cap to blockchain transaction volume, offering insights into market growth and potential bubbles.
A trading tool that enables visual trade plotting on charts, providing real-time profit and loss tracking with interactive entry and exit point selection.
A volume analysis indicator using Volume Spread Analysis and Wyckoff principles to categorize market volume into six levels with color-coded visual representations.
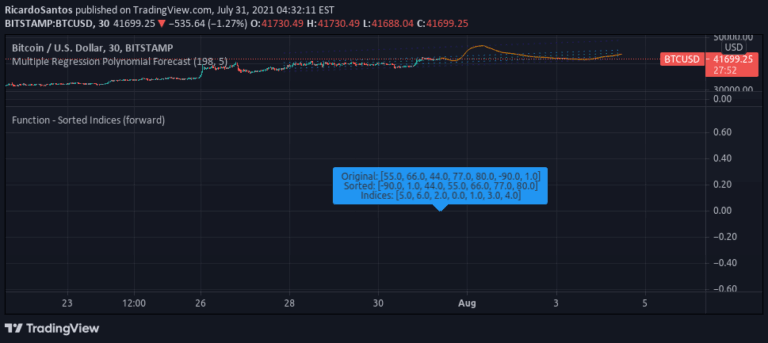
A function that sorts indices in an array using bubble sort algorithm, providing a method to organize and arrange data elements based on their values from lowest to highest.
A dynamic risk assessment tool measuring price deviation from a 20-week Simple Moving Average, providing visual color-coded indicators of market risk levels.
Bollinger Bands signal tool that identifies extreme price movements and potential mean reversion opportunities by tracking price closes beyond standard deviation bands.
Likes, views, and comments are historical TradingView snapshots. They describe attention, not trading performance.