Range Volume Change
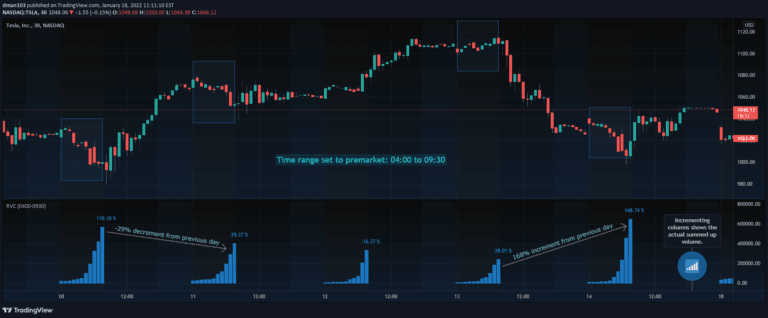
Range Volume Change (RVC) is a custom trading indicator that tracks volume percentage changes within a specific time range, helping traders understand volume dynamics across different trading periods.
Explore 11,183 indicators. Filter beyond the obvious.
Discover the tools that fit the way you trade.
11,183 tools to explore
Range Volume Change (RVC) is a custom trading indicator that tracks volume percentage changes within a specific time range, helping traders understand volume dynamics across different trading periods.
A multiple information panel using tables provides traders with comprehensive visual data representations across various trading metrics, enabling quick and efficient analysis of complex market information.
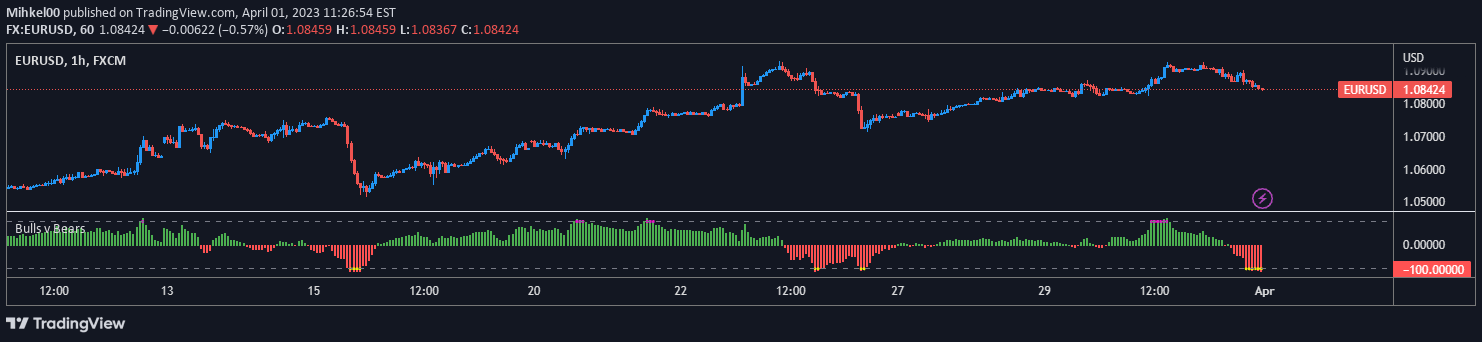
A market strength indicator that compares bullish and bearish momentum by normalizing the difference between price and moving average, helping traders identify potential trend changes.
A dynamic Market Profile indicator that visualizes price distribution across time, showing how price moves through different zones and helping traders understand market behavior and potential trading opportunities.
A visualization tool that stacks daily price changes by week, allowing traders to quickly analyze daily and weekly price movement patterns and volatility across different timeframes.
A banker fund sentiment indicator using price and volume analysis to identify bullish and bearish market trends through color-coded columns that oscillate around a zero axis.
A volume-based indicator that plots the delta between buy and sell volumes, providing visual insight into dominant market volume and potential trend divergences.
A unique Pine Script™ implementation of Tetris that transforms trading chart into a game environment, demonstrating advanced scripting capabilities and algorithmic decision-making.
An advanced trading indicator that compares historical annual percentage returns between two financial symbols, providing visual comparative analysis through a column-based graphical representation.
The Central Bank Dark Energy Oscillator (CBDEO) tracks changes in central bank liquidity using rate of change analysis to provide insights into potential market price action.
Bitcoin ETF capital flow indicator tracking daily net volume across 8 major spot ETFs to help traders understand potential buying and selling pressure in the BTC market.
A custom Pine Script matrix function that converts 1D linear arrays into a 2D matrix structure, enabling advanced data manipulation and storage with built-in dimensional metadata.
Likes, views, and comments are historical TradingView snapshots. They describe attention, not trading performance.