[@btc_charlie] Trader XO Macro Trend Scanner
A trading script combining Exponential Moving Averages (EMAs) and Stochastic RSI to identify market trends, momentum shifts, and potential entry or exit points for traders.
Explore 11,183 indicators. Filter beyond the obvious.
Discover the tools that fit the way you trade.
11,183 tools to explore
A trading script combining Exponential Moving Averages (EMAs) and Stochastic RSI to identify market trends, momentum shifts, and potential entry or exit points for traders.
A unique trading indicator combining Murrey Math formulas with Fibonacci retracement levels to identify potential market tops, bottoms, and long-term trend dynamics with enhanced precision.
A dynamic trend indicator that fits regression lines at different intervals, revealing market trends and potential price channels by calculating linear trends across specified timeframes.
The Ehlers Loops indicator reveals price and volume dynamics through a quadrant-based visual representation, helping traders understand market momentum and potential trend reversals.
A dynamic trend-following indicator that blends trend detection with volume visualization, offering insights into market momentum through color-coded candles and volume histograms.
A neural network-enhanced RSI indicator that uses advanced smoothing techniques to generate precise trading signals across different market conditions and visualization modes.
A comprehensive technical analysis tool combining MACD, RSI, and Bollinger Bands to identify market trends, momentum, and potential reversals through multiple indicator perspectives.
A trend-following indicator using three smoothed lines to analyze market changes across different timeframes, providing visual cloud color and dashboard insights for trend direction.
Average Force is an oscillating indicator that calculates market sentiment by measuring price dynamics and trend strength through smoothed calculations of market movement.
A comprehensive market breadth indicator combining McClellan Summation Index with Heikin-Ashi visualization and MACD analysis to provide advanced trend and momentum insights.
A unique indicator using swing points to project bird-like patterns that reveal potential support/resistance zones and trend direction through visual breakout signals.
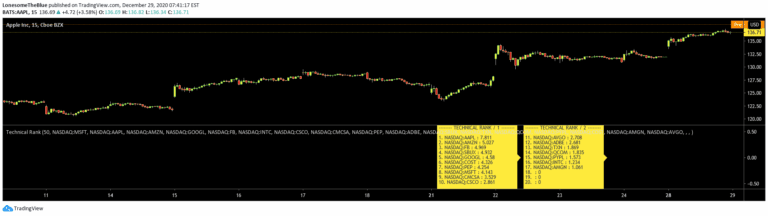
Technical Rank evaluates a security's performance by analyzing multiple indicators across long, medium, and short-term timeframes, providing a comprehensive ranking of technical strength.
Likes, views, and comments are historical TradingView snapshots. They describe attention, not trading performance.