YOUR INDICATOR RESEARCH STARTS HERE

Find the right indicator.
Understand what it does.

Explore 11,183 indicators. Filter beyond the obvious.
Discover the tools that fit the way you trade.

THE INDICATOR LIBRARY

Results for “compound”

11,183 tools to explore

18 indicators matching your filters
Save search
TrendMomentumEditor’s pick

RedK Auto-Stepping Ladder Trader

by RedKTrader

An advanced trading tool that uses an auto-stepping ladder to help identify trade entries and exits across different trading strategies like trend, momentum, and swing trading.

Main price chart · unverifiedDay Trading · Swing Trading
Explore
2.6Klikes76.8Kviews41comments
Save
TrendMomentumEditor’s pick

Financial Growth

by morzor61

A financial analysis tool that compares quarterly, annual, and TTM performance metrics, providing comprehensive insights into company growth through various financial indicators and visualization options.

Separate pane · unverifiedSwing Trading
Explore
1.3Klikes35.5Kviews63comments
Save
TrendEditor’s pick

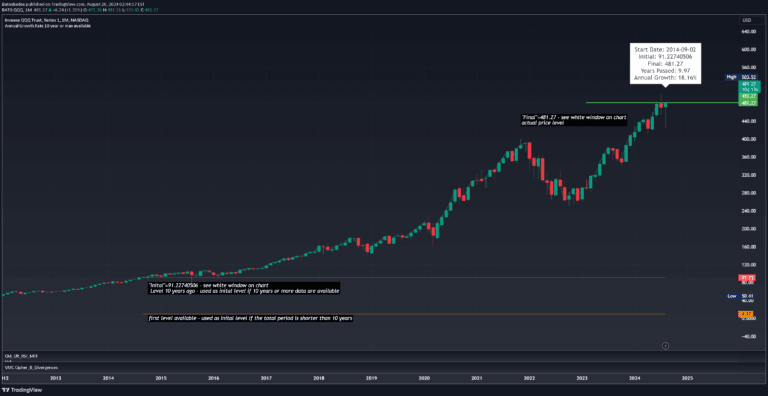
CAGR Custom Range

by TradingView

A Pine Script tool for calculating Compound Annual Growth Rate (CAGR) by interactively selecting two time points on a chart, providing an annualized performance metric.

Main price chart · unverifiedDay Trading · Swing Trading
Explore
1.2Klikes34.6Kviews19comments
Save
MomentumEditor’s pick

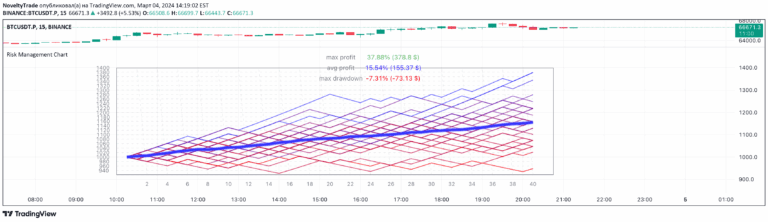
Risk Management Chart

by NoveltyTrade

A trading tool that simulates random trades and visualizes risk management strategies by generating multiple trade scenarios with different win/loss probabilities and equity calculations.

Separate paneDay Trading · Swing Trading
Explore
700likes47.2Kviews8comments
Save
RiskVolatility

Risk Radar Pro

by Julien_Eche

A comprehensive risk assessment tool that dynamically calculates multiple performance metrics, providing investors with adaptive insights into investment volatility, drawdown, and risk-adjusted returns.

Separate pane · unverifiedSwing Trading
Explore
421likes7.8Kviews7comments
Save
SignalTrend

CAGR Projection

by Julien_Eche

A CAGR Projection Indicator that visualizes potential asset growth by overlaying a projection line on price charts, enabling comparison of actual performance against hypothetical growth scenarios.

Main price chart · unverifiedSwing Trading
Explore
86likes1.6Kviews0comments
Save
LevelsPortfolioSignal

Portfolio Management [TrendX_]

by TrendX_

A comprehensive portfolio management tool that helps investors analyze stock performance, evaluate risk factors, and optimize investment strategies using advanced financial metrics.

Main price chart · unverifiedSwing Trading
Explore
57likes1.8Kviews0comments
Save

Likes, views, and comments are historical TradingView snapshots. They describe attention, not trading performance.

START WITH A QUESTION

A little less searching.
A lot more understanding.

Tell DeepAlpha what you need. Get an explanation, a shortlist,
and a direct path to the indicators behind it.

Ask DeepAlpha