YOUR INDICATOR RESEARCH STARTS HERE

Find the right indicator.
Understand what it does.

Explore 11,183 indicators. Filter beyond the obvious.
Discover the tools that fit the way you trade.

THE INDICATOR LIBRARY

Results for “days”

11,183 tools to explore

443 indicators matching your filters
Save search
TrendMomentumEditor’s pick

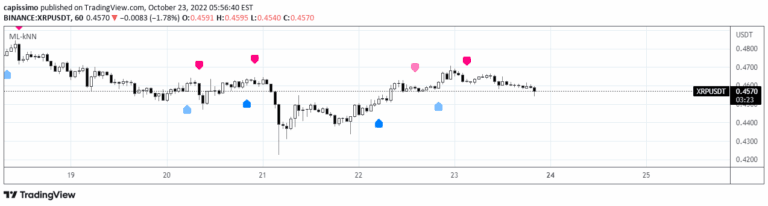
Machine Learning: kNN-based Strategy

by capissimo

A k-Nearest Neighbours machine learning strategy that predicts market moves by analyzing historic data and finding similar past market conditions to forecast future price directions.

Main price chart · unverifiedSwing Trading
Explore
6Klikes220.8Kviews149comments

Save
TrendMomentumEditor’s pick

Zigzag Trend/Divergence Detector

by Trendoscope

A trading signal that combines trend bias, oscillator analysis, and divergence detection to help traders make more informed decisions about trend continuation, reversal, and potential profit-taking.

Separate pane · unverifiedSwing Trading
Explore
5.9Klikes243.6Kviews148comments
Save
VolumeTrendEditor’s pick

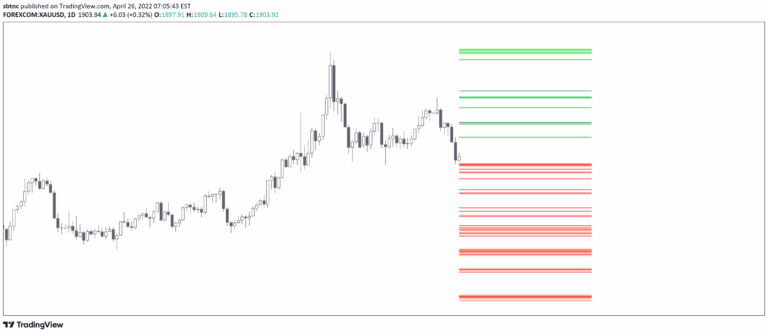
HTF Liquidity Levels

by sbtnc

A trading indicator that identifies untapped liquidity levels across different timeframes, helping traders understand potential price movement magnets and liquidity pools in the market.

Main price chart · unverifiedDay Trading · Swing Trading
Explore
4Klikes177.3Kviews83comments
Save
TrendMomentumEditor’s pick

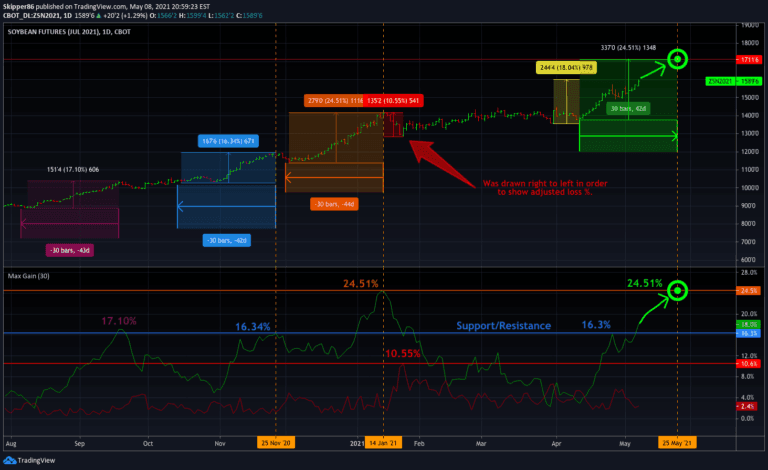
Max Gain

by Skipper86

A trading indicator that calculates potential price targets by analyzing percentage gains and losses over a specified time period, helping traders identify potential resistance levels and performance targets.

Separate pane · unverifiedSwing Trading
Explore
3.1Klikes60Kviews15comments
Save
LevelsSignal

High/Low Location Frequency [LuxAlgo]

by LuxAlgo

A market analysis tool that calculates probabilities of price tops and bottoms across various time periods, offering traders strategic insights into market timing and potential trend reversals.

Separate pane · unverifiedScalping · Day Trading
Explore
2.5Klikes48.1Kviews7comments
Save
OscillatorSignalTrend

Seasonality Chart [LuxAlgo]

by LuxAlgo

A tool that reveals seasonal price variations by calculating average price changes for specific days across multiple years, helping traders identify recurring market patterns.

Separate pane · unverifiedSwing Trading
Explore
2.2Klikes47.7Kviews7comments
Save
TrendEditor’s pick

Seasonality [TFO]

by tradeforopp

A seasonality indicator that analyzes an asset's historical performance across daily, monthly, and quarterly timeframes, revealing patterns of market behavior throughout the year.

Separate pane · unverifiedSwing Trading
Explore
2Klikes53.9Kviews33comments
Save
TrendVolatilityEditor’s pick

Probability Cones

by joebaus

A probability cone is a statistical forecast indicator that visualizes potential price distribution using standard or Laplace distributions, helping traders understand potential price movement ranges.

Main price chart · unverifiedDay Trading · Swing Trading
Explore
1.9Klikes73.2Kviews63comments
Save
LevelsSignal

Key Levels | Flux Charts

by fluxchart

A customizable indicator that displays key market levels including daily, pre-market, and historical highs and lows to help traders identify potential support and resistance zones.

Main price chart · unverifiedScalping · Day Trading
Explore
1.9Klikes50.7Kviews21comments
Save
Signal

Weekly and daily separators

by Remote-Trading

A visual time-tracking tool that plots vertical lines marking trading weeks and days to help traders maintain a clearer perspective on time-related aspects across different chart timeframes.

Main price chart · unverifiedScalping · Day Trading
Explore
1.6Klikes28.2Kviews32comments
Save

Likes, views, and comments are historical TradingView snapshots. They describe attention, not trading performance.

START WITH A QUESTION

A little less searching.
A lot more understanding.

Tell DeepAlpha what you need. Get an explanation, a shortlist,
and a direct path to the indicators behind it.

Ask DeepAlpha