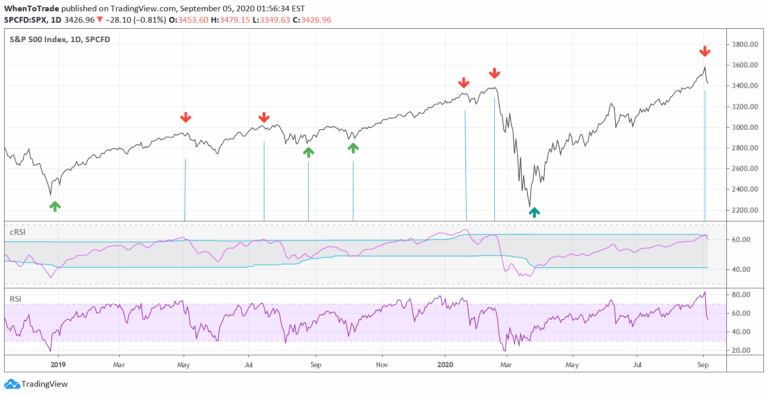
RSI cyclic smoothed v2
An enhanced RSI indicator that uses cyclic smoothing and adaptive bands to provide more responsive market trend signals by incorporating dominant cycle length.
Explore 11,183 indicators. Filter beyond the obvious.
Discover the tools that fit the way you trade.
11,183 tools to explore
An enhanced RSI indicator that uses cyclic smoothing and adaptive bands to provide more responsive market trend signals by incorporating dominant cycle length.
A trend channel indicator that identifies support and resistance zones using pivot highs and lows, helping traders visualize market trends and potential breakout points.
A trading signal that analyzes price action in relation to volume pressure, providing insights into market trends through volume-based histograms and buy-sell convergence/divergence indicators.
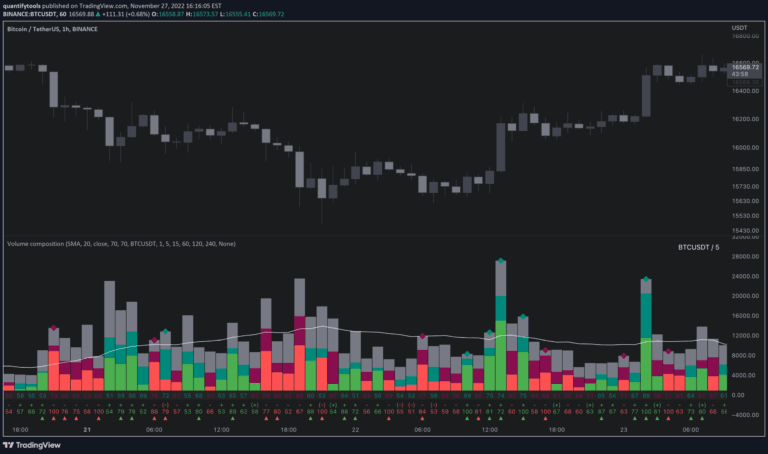
Volume composition indicator that breaks down trading volume into buy, sell, passive, and active components to provide deeper insights into market liquidity and potential price movements.
A sophisticated market cycle detection method that uses Detrended Price Oscillator to identify rhythmic patterns and dominant cycles in price movements, helping traders optimize technical indicator settings.
A dynamic volume indicator that breaks down buy and sell volume proportions within each candle, showing real-time volume distribution and highlighting which side dominates trading activity.
A Smart Money Concept trading signal that identifies market trends by analyzing order blocks and breakouts of structure to confirm dominant market direction.
A multi-timeframe indicator that analyzes higher timeframe candle sentiments and colors current chart candles based on dominant market direction across selected timeframes.
A sophisticated signal processing technique that identifies dominant market cycles by applying linear predictive filters to price data, helping traders adapt strategies to changing market conditions.
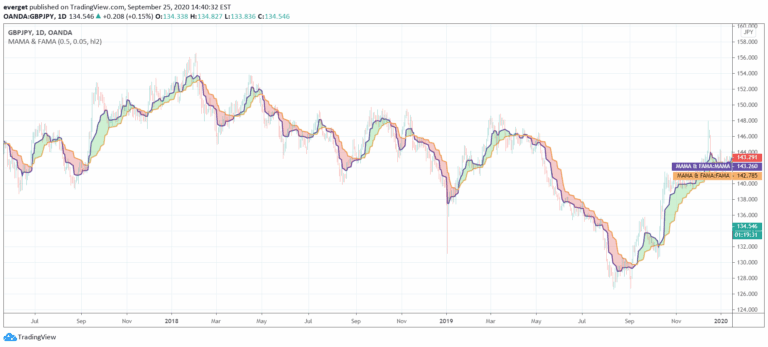
Ehlers MESA Adaptive Moving Averages (MAMA & FAMA) are dynamic technical indicators that adjust moving average sensitivity based on market cycles and price momentum.
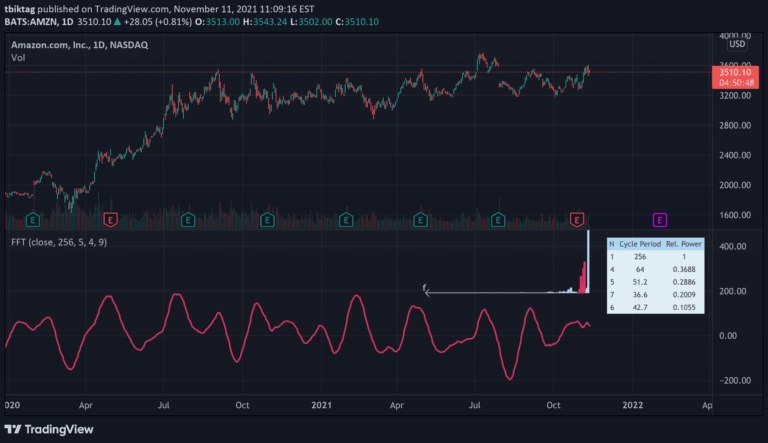
A Fast Fourier Transform (FFT) algorithm that decomposes time series data into cyclical frequency components, enabling advanced time series filtering and analysis.
Dynamic Point of Control indicator that reveals market-dominant price levels using volume or price profiles, helping traders identify key support and resistance zones with customizable analysis.
Likes, views, and comments are historical TradingView snapshots. They describe attention, not trading performance.