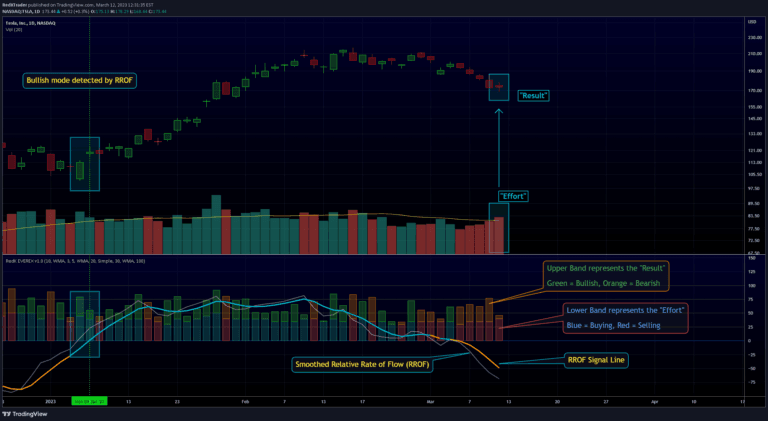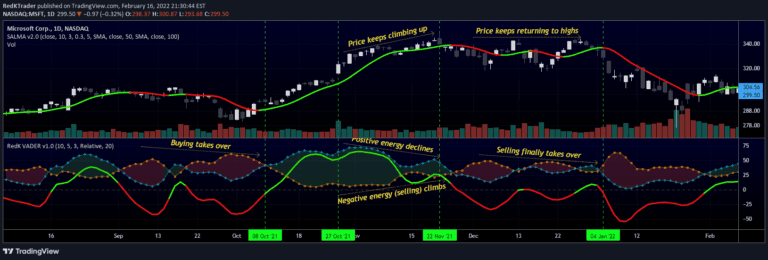
RedK Volume-Accelerated Directional Energy Ratio (RedK VADER)
VADER is a volume-based technical indicator that measures market energy by analyzing price displacement and trading volume to determine bullish or bearish market sentiment.
Explore 11,183 indicators. Filter beyond the obvious.
Discover the tools that fit the way you trade.
11,183 tools to explore
VADER is a volume-based technical indicator that measures market energy by analyzing price displacement and trading volume to determine bullish or bearish market sentiment.
An experimental trading indicator that analyzes volume and price action using Volume Price Analysis and Wyckoff's Effort versus Result law to detect market strength and potential reversals.
Volume Spread Analysis indicator that detects market divergences and convergences by analyzing the relationship between price movements and trading volume.
Volume Spread Analysis indicator helps traders understand market intentions by analyzing volume and price movements through color-coded bars and predictive volume forecasting techniques.
An adaptive moving average that uses price range effort versus result to dynamically adjust its sensitivity, providing traders with color-coded signals for potential buy and sell opportunities.
An adaptive moving average that dynamically adjusts its smoothing factor based on market volatility, tracking price movements more accurately during trending and congestion periods.
A specialized trading indicator for Indian stock markets that identifies key price movements at 3:15 PM, helping traders make quick BTST (Buy Today, Sell Tomorrow) decisions.
ZVOL transforms raw volume data into a statistically calibrated heatmap using Z-score thresholds, revealing meaningful crowd behavior across different market conditions.
Volumetric Tensegrity is a compact volume analysis tool that measures market pressure and directional conviction through volume deviation and on-balance volume tracking.
Money Flow Pulse (MFP) is a volume-driven indicator that analyzes price action and volume to reveal the quality and conviction behind market movements across different timeframes.
A trading indicator that compares Average True Range (ATR) to volume, highlighting price bars that meet specific volatility and trading activity criteria for potential market opportunities.
VoluTility is a volume-based indicator that forecasts trend exhaustion and breakout potential by measuring volatility within the trading volume stream.
Likes, views, and comments are historical TradingView snapshots. They describe attention, not trading performance.