Divergence-Support/Resistence
A trading signal that identifies support and resistance levels using zigzag patterns, divergence detection, and oscillator analysis to highlight potential trend reversals and market momentum shifts.
Explore 11,183 indicators. Filter beyond the obvious.
Discover the tools that fit the way you trade.
11,183 tools to explore
A trading signal that identifies support and resistance levels using zigzag patterns, divergence detection, and oscillator analysis to highlight potential trend reversals and market momentum shifts.
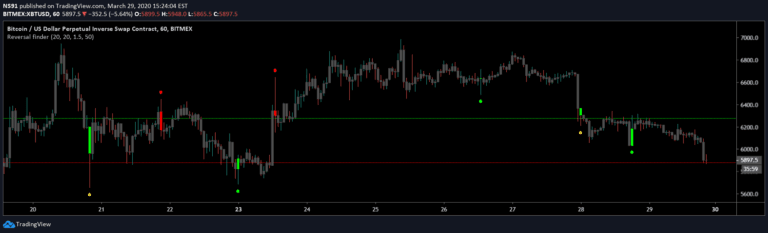
A trading signal that identifies potential price reversals by analyzing false breakouts of support and resistance levels through range and position analysis of price bars.
A technical analysis method identifying divergences between price action and indicators to predict potential trend reversals or continuations in stock trading.
False Breakout is a technical analysis method identifying price movements that momentarily break key levels but quickly reverse, offering strategic trading opportunities.
A volatility detection system that identifies indecisive price action and compressed ranges, tracking potential market tension and volatility breakouts across multiple timeframes.
An advanced intraday trend indicator using Look Back Period and moving averages to dynamically track market trends with color-coded candles and trend lines.
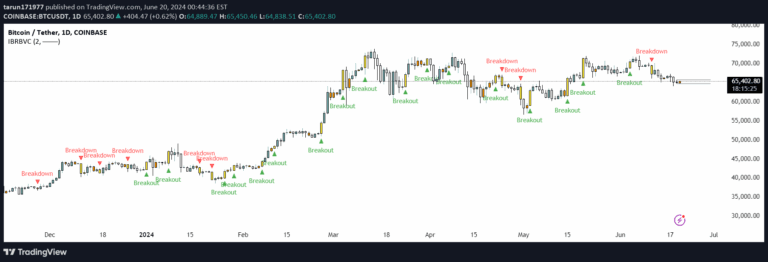
Inside bars are trading pattern where the current bar's price range is completely contained within the previous bar's range, offering potential trend continuation or reversal signals.
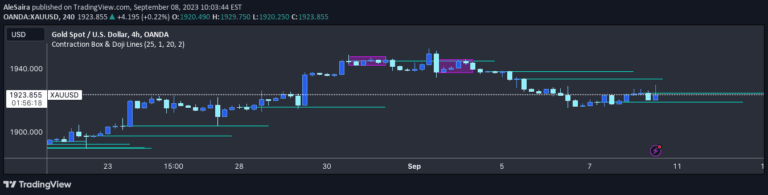
A technical indicator that identifies doji candlestick patterns and price contraction zones, highlighting potential support and resistance levels to help traders anticipate market movements.
A TradingView indicator designed to identify sideways or ranging market conditions by analyzing price movement and volatility with customizable sensitivity parameters.
A correlation-based indicator tracking Put to Call ratio against stock price, revealing market sentiment and potential reversals through statistical analysis of options trading activity.
Japanese Candlesticks are visual price movement representations that help traders analyze market trends and potential trading opportunities through specific pattern recognitions.
A trading indicator that identifies potential buy and sell signals by creating rectangles around doji candlesticks and tracking price movements relative to these zones.
Likes, views, and comments are historical TradingView snapshots. They describe attention, not trading performance.