Composite Scaled EMA Levels
A composite EMA indicator that compares an asset's closing price with the XU100 index, scaling EMA values to provide unique market trend and support/resistance insights.
Explore 11,183 indicators. Filter beyond the obvious.
Discover the tools that fit the way you trade.
11,183 tools to explore
A composite EMA indicator that compares an asset's closing price with the XU100 index, scaling EMA values to provide unique market trend and support/resistance insights.
A trading tool that identifies consolidation zones on charts, helping traders spot potential breakout and breakdown areas across multiple timeframes.
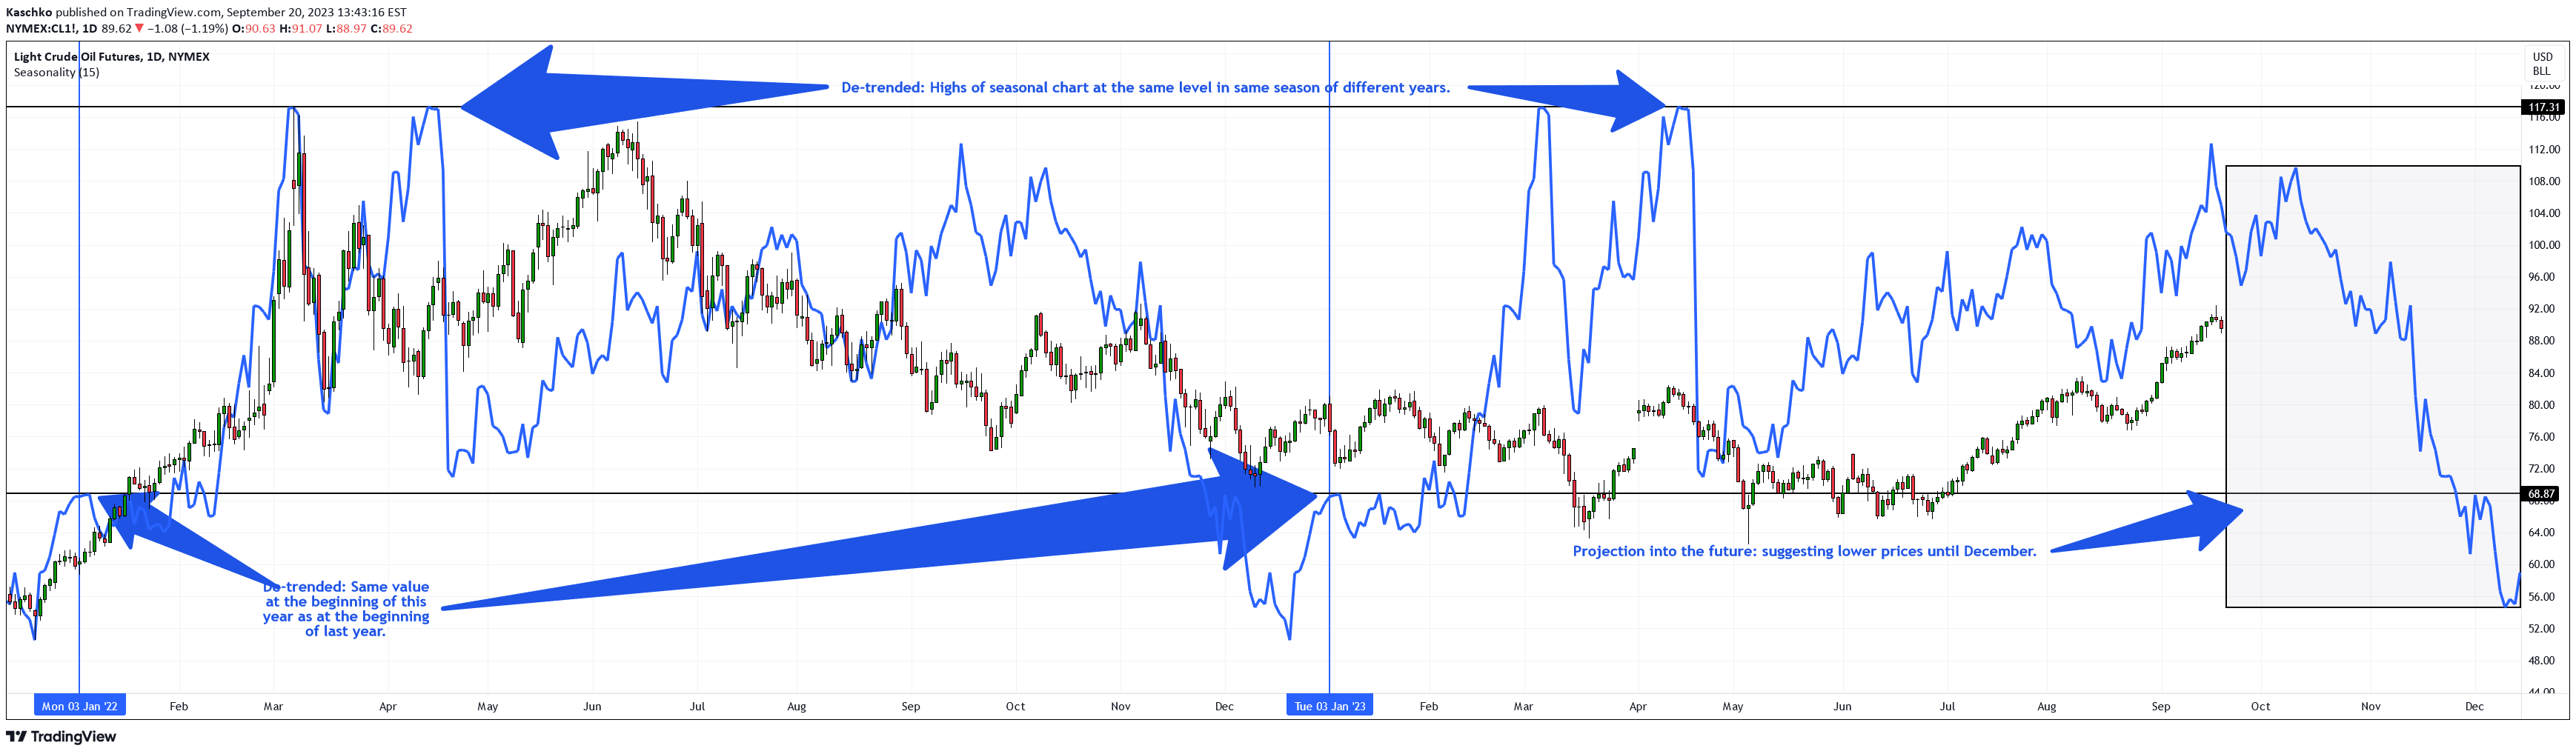
A seasonal trend analysis tool that calculates average price moves across multiple years to create a projected seasonal chart overlay, revealing potential market behavior patterns.
A trading strategy that identifies market sessions, tracks price highs and lows, and highlights Fair Value Gaps (FVGs) to help traders understand market structure and potential trading opportunities.
A real-time volume analysis indicator that tracks buying and selling volume percentages and triggers gas signals when volume reaches predefined thresholds.
A comprehensive candlestick pattern recognition tool that automatically identifies and highlights key price action patterns directly on TradingView charts for informed trading decisions.
A tool for comparing relative performance and correlation of symbols within a specific market sector by displaying percentage-scaled price movements on a single chart.
An advanced On-Balance Volume (OBV) indicator that uses standard deviation bands and EMAs to analyze volume flow, detect market maker activity, and predict potential price movements.
A momentum oscillator tracking KASPA's price slope by normalizing and smoothing price changes, revealing potential buy and sell signals through overbought and oversold conditions.
A Cumulative Delta Volume indicator that visualizes buying and selling pressure through color-coded waves, helping traders understand market momentum and sentiment shifts.
A multi-timeframe indicator that visualizes price ranges across two different time periods using color-coded boxes for trend analysis and support/resistance identification.
A dynamic indicator that tracks previous candle high and low levels across multiple timeframes, providing key support and resistance reference points for traders' strategic decision-making.
Likes, views, and comments are historical TradingView snapshots. They describe attention, not trading performance.