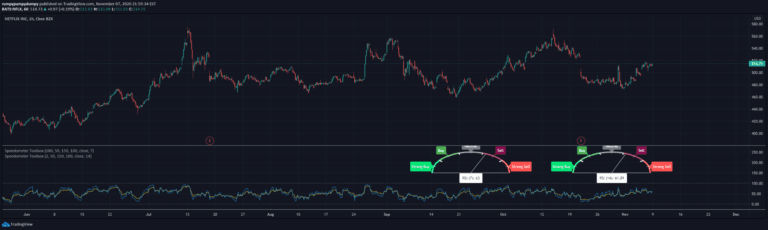
Liquidations Meter [LuxAlgo]
A dynamic tool that analyzes potential liquidation points in trading, measuring market momentum, identifying trader positioning, and highlighting potential reversal zones.
Explore 11,183 indicators. Filter beyond the obvious.
Discover the tools that fit the way you trade.
11,183 tools to explore
A dynamic tool that analyzes potential liquidation points in trading, measuring market momentum, identifying trader positioning, and highlighting potential reversal zones.
Custom metric speedometers provide specialized visualization techniques for tracking and representing performance indicators through graphical gauge-like representations.
HTF Candle Volume Thermometer is an advanced volume heatmap tool that visualizes higher timeframe volume distribution, helping traders identify key liquidity zones and price levels.
A currency strength indicator that measures relative performance of currencies by comparing their exchange rates and tracking their strength over time using a specialized meter and scatter plot.
A spider chart visualization tool that combines multiple oscillators to provide a comprehensive view of market sentiment and trend dynamics using normalized indicators.
A dynamic trading indicator that uses curved price channels to adapt to market volatility, providing flexible trend identification with built-in trend strength analysis.
A technical indicator that measures market volatility and momentum to help traders identify optimal trading periods and filter out false signals across different market conditions.
A comprehensive indicator analyzing cryptocurrency wallet profitability by tracking on-chain data, showing percentages of wallets in profit, loss, or breaking even across different timeframes.
A dynamic RSI variant that adapts its calculation length based on market volatility and momentum, providing more responsive and context-aware trading signals.
Advanced Heikin Ashi indicator with smooth step oscillator that enhances trend analysis through sophisticated smoothing techniques and customizable momentum visualization.
A comprehensive trading indicator that combines trend detection, momentum analysis, and strength meters with a futuristic OLED-style dashboard for enhanced market insights and visual trading experience.
A custom speedometer visualization tool that converts complex market data like analyst recommendations and put-call ratios into an intuitive graphical representation of market sentiment and trend.
Likes, views, and comments are historical TradingView snapshots. They describe attention, not trading performance.