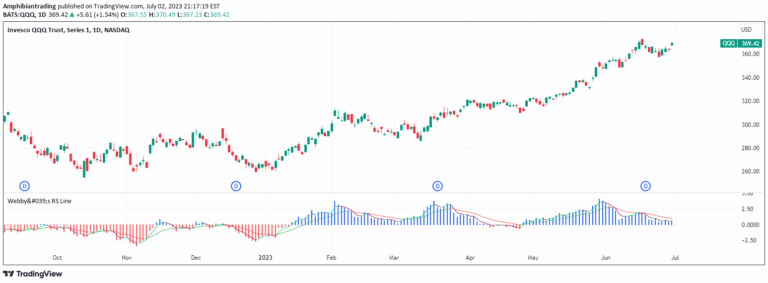
RS Rating
The RS Rating evaluates a stock's price performance relative to the market over 52 weeks, helping traders identify stocks that are outperforming and potentially poised for further gains.
Explore 11,183 indicators. Filter beyond the obvious.
Discover the tools that fit the way you trade.
11,183 tools to explore
The RS Rating evaluates a stock's price performance relative to the market over 52 weeks, helping traders identify stocks that are outperforming and potentially poised for further gains.
A volatility-adjusted relative strength indicator that compares a stock's performance to a benchmark index by normalizing price movements using Average True Range.
Relative strength measures a stock's price performance compared to a market index, revealing how an asset performs relative to a benchmark over a specific time period.
CANSLIM is an advanced stock screening strategy that evaluates companies across seven critical growth indicators to identify potentially high-performing stocks in the market.
A relative strength indicator that compares a stock's performance against the S&P 500 using low prices and exponential moving averages to identify momentum shifts.
An earnings gap analysis tool that identifies three types of stock price jumps after earnings reports, marking key price levels and tracking potential outperformance windows.
The Relative Strength Indicator measures a security's performance against a benchmark, calculating outperformance or underperformance in percentage terms to provide comparative market insights.
Relative Strength compares a stock's performance against a benchmark index, revealing its strength or weakness relative to the broader market based on percentage changes.
A relative strength indicator comparing a stock's performance against a market index, showing outperformance or underperformance through a zero-line oscillating metric.
A multi-timeframe performance analysis tool that measures asset outperformance through Zone of Outperformance Ratio (ZOR) and supplementary trend indicators.
A relative strength indicator that compares a stock's performance against an index by dividing their prices and plotting the GMMA to analyze trend strength and potential outperformance.
The Relative Daily Change% indicator compares a stock's average daily price change with a selected index over 200 days, using color-coded signals to highlight performance.
Likes, views, and comments are historical TradingView snapshots. They describe attention, not trading performance.