Global M2 Money Supply Top20 + Offset & Wave
A global M2 money supply indicator tracking liquidity across the top 20 economies, providing insights into monetary trends and potential market impacts.
Explore 11,183 indicators. Filter beyond the obvious.
Discover the tools that fit the way you trade.
11,183 tools to explore
A global M2 money supply indicator tracking liquidity across the top 20 economies, providing insights into monetary trends and potential market impacts.
A multi-timeframe Volume Weighted Average Price (VWAP) indicator that helps traders analyze market trends, identify support and resistance levels across various timeframes.
A VWAP indicator that displays current and previous days' volume-weighted average price levels with custom alerts and deviation gradient visualization for intraday trading analysis.
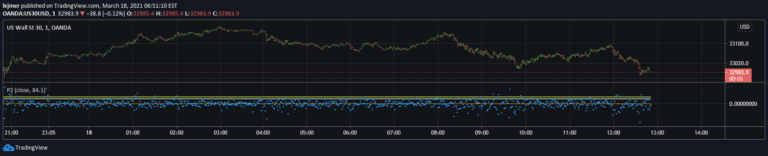
A statistical method for estimating percentiles in financial data series using the P-Square algorithm, which provides a fast and accurate approach to understanding data distribution and variability.
Dynamic Trend Fusion combines MACD and RSI to create an adaptable technical analysis tool that identifies market trends and provides customizable trading insights.
An innovative Parabolic SAR variant using elliptic curve mathematics to dynamically detect market trends with enhanced visual indicators and adaptive acceleration factors.
A comprehensive MACD indicator that calculates multiple MACD lines, averages them, and detects market conditions through visual color-coded signals for trend analysis.
A trading script that identifies and marks the first and second high/low points across multiple timeframes, providing a structured approach to tracking price extremes.
A sophisticated momentum oscillator that combines multiple advanced concepts to analyze market dynamics, providing insights into trend stability, volatility, and potential turning points across different timeframes.
A dynamic trading tool combining daily pivot levels with EMA ribbons to help traders identify market structure, momentum, and key decision zones with visual clarity.
The Fibonacci RSI Levels indicator uses Fibonacci percentages and logarithmic RSI calculation to plot key momentum zones, helping traders identify support, resistance, and potential market reversals.
A trading strategy using multiple moving averages to identify trend direction and potential entry/exit points in crypto markets, primarily on 1-hour charts.
Likes, views, and comments are historical TradingView snapshots. They describe attention, not trading performance.