Industry Group Strength
A trading tool that identifies top-performing stocks within specific industry groups by analyzing performance metrics like YTD return and relative strength.
Explore 11,183 indicators. Filter beyond the obvious.
Discover the tools that fit the way you trade.
11,183 tools to explore
A trading tool that identifies top-performing stocks within specific industry groups by analyzing performance metrics like YTD return and relative strength.
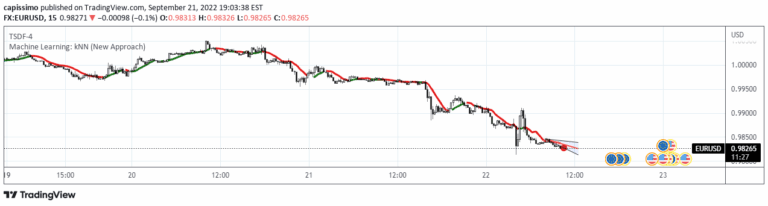
KNN is a machine learning technique predicting next price bar using nearest neighbor data points, providing trend insights by analyzing historical price sequences.
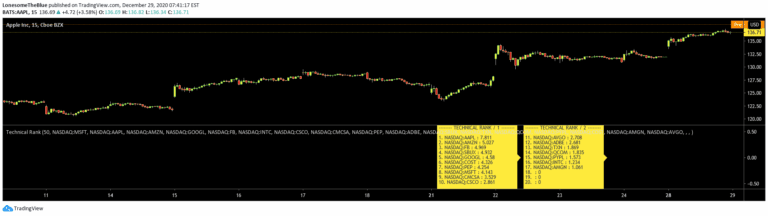
Technical Rank evaluates a security's performance by analyzing multiple indicators across long, medium, and short-term timeframes, providing a comprehensive ranking of technical strength.
A volatility indicator that measures market price fluctuations by calculating historical standard deviation and percentage ranking to provide a dynamic scale of market volatility.
A volume-based indicator that highlights the most active trading candles, helping traders identify significant market moments with color-coded volume visualization.
Median RSI SD is an advanced momentum oscillator that uses median price filtering and RSI to detect trend shifts and potential reversals with enhanced signal clarity and noise reduction.
A precise weighted percentile algorithm for calculating nearest rank percentiles, offering a robust method for statistical analysis and data ranking with variable importance weights.
A unique indicator that displays price movement and volume in a comparative format, offering multiple visualization options like percentile ranking, Bollinger Bands, and moving averages.
An adaptive moving average crossover indicator that dynamically selects the most effective MA period by backtesting and ranking performance in real-time for precise trading signals.
A stock ranking strategy analyzing companies' return on capital and earnings yield to identify potentially undervalued stocks with strong financial performance.
A statistical method measuring non-linear correlation between two market variables like volume and trend, using Chatterjee Correlation Coefficient to understand potential relationships.
A unique volume indicator that normalizes and transforms volume data using Fisher Transformation, offering three distinct modes for analyzing market trends and volume strength.
Likes, views, and comments are historical TradingView snapshots. They describe attention, not trading performance.