YOUR INDICATOR RESEARCH STARTS HERE

Find the right indicator.
Understand what it does.

Explore 11,183 indicators. Filter beyond the obvious.
Discover the tools that fit the way you trade.

THE INDICATOR LIBRARY

Results for “scaled”

11,183 tools to explore

73 indicators matching your filters
Save search
VolumeTrendSignalEditor’s pick

Ehlers Loops [BigBeluga]

by BigBeluga

The Ehlers Loops indicator reveals price and volume dynamics through a quadrant-based visual representation, helping traders understand market momentum and potential trend reversals.

Separate pane · unverifiedScalping · Day Trading
Explore
3Klikes107.3Kviews26comments
Save
ChannelsSignalTrendEditor’s pick

Trend Impulse Channels (Zeiierman)

by Zeiierman

A trend-following system that uses volatility-scaled steps to track market momentum, visualizing trend progression through discrete channels and adaptive volatility bands.

Main price chart · unverifiedDay Trading · Swing Trading
Explore
2.5Klikes36.4Kviews14comments
Save
LevelsSignalVolume

Dynamic Liquidity Depth [BigBeluga]

by BigBeluga

A liquidity mapping engine that reveals potential stop-loss zones and hidden market vulnerabilities by analyzing volume distribution above and below recent price extremes.

Main price chart · unverifiedScalping · Day Trading
Explore
1.7Klikes19.5Kviews10comments
Save
TrendMomentumOscillator

Osmosis [ChartPrime]

by ChartPrime

Osmosis is a multi-indicator heatmap that visualizes market trends across different time periods, revealing potential trend reversals and significant market movements.

Separate pane · unverifiedScalping · Day Trading
Explore
1.5Klikes35.1Kviews20comments
Save
LevelsTrend

Composite Scaled EMA Levels

by AhmetKasa

A composite EMA indicator that compares an asset's closing price with the XU100 index, scaling EMA values to provide unique market trend and support/resistance insights.

Main price chart · unverifiedDay Trading · Swing Trading
Explore
1.5Klikes13.3Kviews4comments
Save
VolumeEditor’s pick

Order Chain [Kioseff Trading]

by KioseffTrading

Order Chain is a live tick volume indicator that tracks real-time order flow dynamics, recording volume delta and order sizes at specific price levels to provide insights into market buying and selling pressure.

Separate pane · unverifiedScalping · Day Trading
Explore
1.4Klikes63.9Kviews25comments
Save
VolumeTrendEditor’s pick

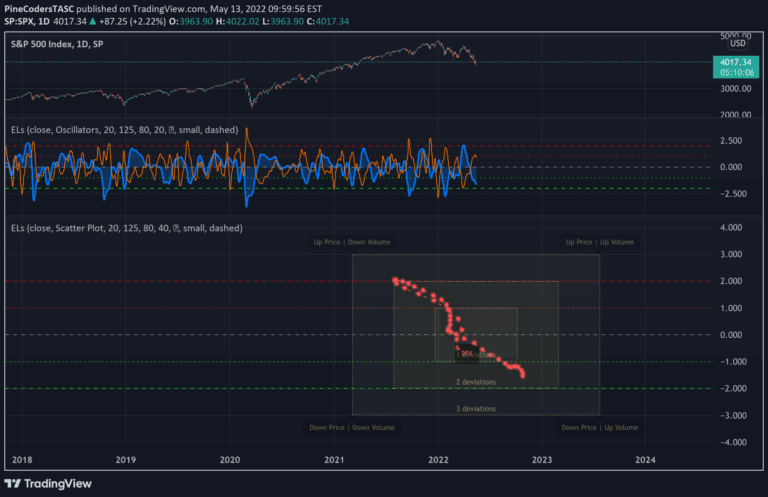
TASC 2022.06 Ehlers Loops

by PineCodersTASC

Ehlers Loops is an advanced visualization technique that compares filtered and scaled price and volume data to reveal potential market conditions and trading insights.

Separate pane · unverifiedDay Trading · Swing Trading
Explore
706likes35.6Kviews11comments
Save

Likes, views, and comments are historical TradingView snapshots. They describe attention, not trading performance.

START WITH A QUESTION

A little less searching.
A lot more understanding.

Tell DeepAlpha what you need. Get an explanation, a shortlist,
and a direct path to the indicators behind it.

Ask DeepAlpha