Market Monitor
A dynamic market overview tool that tracks percentage changes across multiple indices or sectors, allowing traders to quickly assess performance and trends across different timeframes.
Explore 11,183 indicators. Filter beyond the obvious.
Discover the tools that fit the way you trade.
11,183 tools to explore
A dynamic market overview tool that tracks percentage changes across multiple indices or sectors, allowing traders to quickly assess performance and trends across different timeframes.
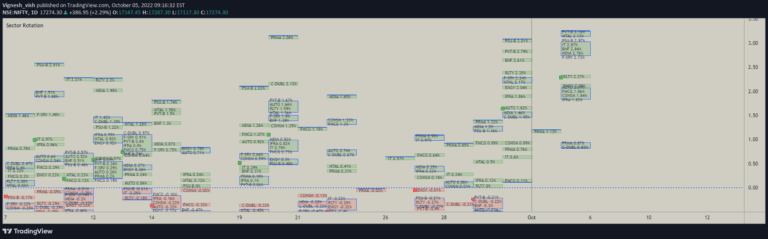
A comprehensive trading tool for visualizing and tracking performance across major Indian market sectors, allowing real-time and historical sector analysis with customizable visualization options.
A comprehensive trading tool that compares fundamental metrics across multiple assets using various charting methods, enabling detailed financial analysis and visualization.
Historical Correlation tool calculates correlation coefficients between assets, revealing how different financial instruments move in relation to each other over time.
A sector relative strength indicator that compares performance of multiple sector indices against a benchmark, helping traders identify outperforming and underperforming market segments.
The Investment Clock Orbital Graph is a macro trading tool that visualizes economic cycles by tracking GDP growth and CPI inflation rates across different market phases.
A sector momentum indicator tracking stocks above their 20-day moving average, revealing market sector rotation and potential market corrections through MACD-like analysis.
A weekly rotation strategy tracking market cycles between value and growth ETFs using relative strength and volume flow indicators to optimize portfolio performance.
A custom indicator that compares two asset prices by plotting their price ratio, helping traders analyze relative performance and market relationships.
Analyzes money movement across different market sectors by comparing sector-specific ETFs against MSCI World, providing insights into potential investment opportunities.
A tool for comparing relative performance and correlation of symbols within a specific market sector by displaying percentage-scaled price movements on a single chart.
A performance comparison tool that tracks relative price changes of a ticker against an index over multiple timeframes, providing insights into comparative market performance.
Likes, views, and comments are historical TradingView snapshots. They describe attention, not trading performance.