Dynamic Linear Regression Channels
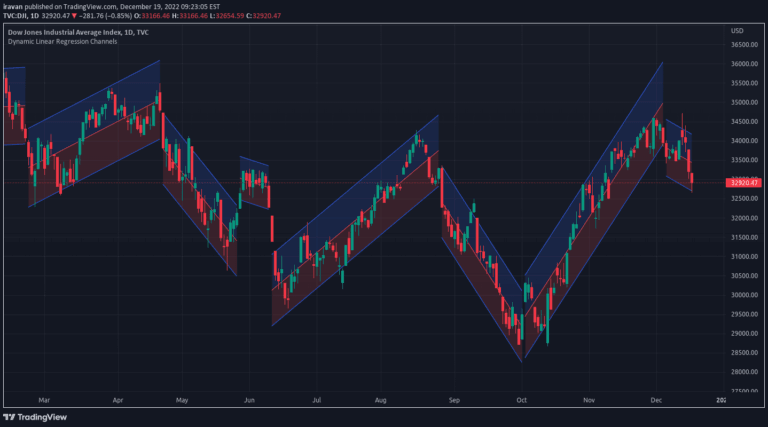
A dynamic linear regression channel indicator that adapts to price movements by creating new channels when previous channels break, helping traders identify trend changes and key price levels.
Explore 11,183 indicators. Filter beyond the obvious.
Discover the tools that fit the way you trade.
11,183 tools to explore
A dynamic linear regression channel indicator that adapts to price movements by creating new channels when previous channels break, helping traders identify trend changes and key price levels.
A dynamic trading panel displaying multiple technical indicators in a color-coded table format, allowing traders to quickly assess market conditions across multiple symbols simultaneously.
A comprehensive trading signal that provides key market insights including market capitalization, float percentage, average daily range, and trading volume metrics for informed investment decisions.
RSI Past is a custom trading signal that tracks the directional momentum of a stock by comparing the number of bars since recent overbought and oversold RSI conditions.
A dynamic market overview tool that tracks percentage changes across multiple indices or sectors, allowing traders to quickly assess performance and trends across different timeframes.
Asset Rotation Aperture tracks volume accumulation across multiple assets, visualizing capital rotation and market narratives through normalized cumulative volume lines.
A correlation matrix tool that visualizes relationships between 10 different assets, revealing how different securities move in relation to each other using statistical coefficients.
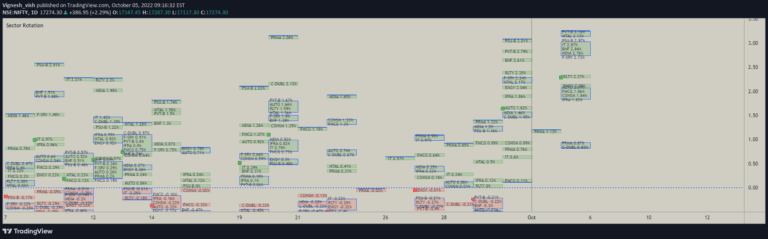
A comprehensive trading tool for visualizing and tracking performance across major Indian market sectors, allowing real-time and historical sector analysis with customizable visualization options.
A Pine Script tool for calculating Compound Annual Growth Rate (CAGR) by interactively selecting two time points on a chart, providing an annualized performance metric.
A comprehensive trading tool that compares fundamental metrics across multiple assets using various charting methods, enabling detailed financial analysis and visualization.
A trading strategy focused on identifying and trading significant price gaps in stock markets, exploiting the difference between opening and previous closing prices to generate trading signals.
A multi-asset histogram indicator that calculates performance scores for up to 10 different assets, providing a comprehensive visual comparison of their relative trends and strengths.
Likes, views, and comments are historical TradingView snapshots. They describe attention, not trading performance.