YOUR INDICATOR RESEARCH STARTS HERE

Find the right indicator.
Understand what it does.

Explore 11,183 indicators. Filter beyond the obvious.
Discover the tools that fit the way you trade.

THE INDICATOR LIBRARY

Results for “square”

11,183 tools to explore

98 indicators matching your filters
Save search
Trend

Hull Suite

by InSilico

Hull Moving Average (HMA) is an advanced technical indicator designed to minimize lag and provide smooth trend visualization across multiple variants with customizable settings.

Main price chart · unverifiedDay Trading · Swing Trading
Explore
15.9Klikes467.4Kviews140comments
Save
MomentumEditor’s pick

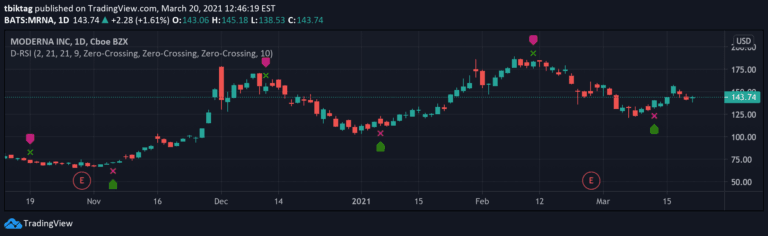
Delta-RSI Oscillator Strategy

by tbtkg

Delta-RSI Oscillator is a momentum indicator that measures the rate of change in RSI through a smoothed time derivative, providing dynamic insights into market momentum shifts.

Separate pane · unverifiedDay Trading · Swing Trading
Explore
6.5Klikes216.5Kviews72comments
Save
TrendVolatilityEditor’s pick

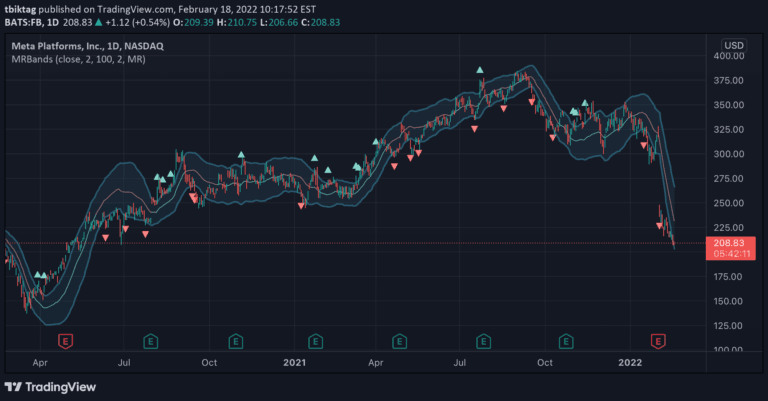
Moving Regression Prediction Bands

by tbtkg

Moving Regression Prediction Bands combine regression analysis and statistical prediction to create a dynamic price prediction channel with upper and lower bands indicating potential price momentum and trend shifts.

Main price chart · unverifiedDay Trading · Swing Trading
Explore
3.5Klikes100.6Kviews33comments
Save
TrendEditor’s pick

TF Segmented Linear Regression

by alexgrover

A dynamic trend indicator that fits regression lines at different intervals, revealing market trends and potential price channels by calculating linear trends across specified timeframes.

Main price chart · unverifiedSwing Trading
Explore
3.1Klikes51.4Kviews27comments
Save
TrendMomentumEditor’s pick

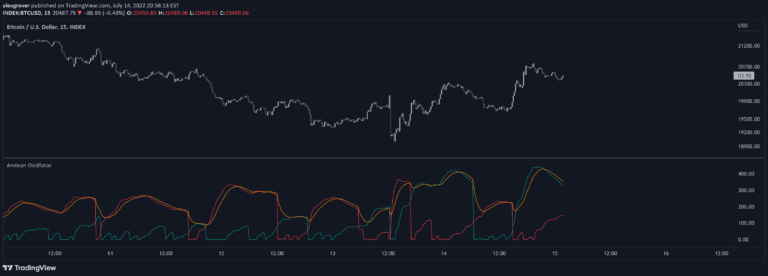
Andean Oscillator

by alexgrover

The Andean Oscillator is a trend analysis indicator that measures price variations by comparing bullish and bearish components to identify market direction and potential trend shifts.

Separate pane · unverifiedDay Trading · Swing Trading
Explore
2.6Klikes95Kviews86comments
Save
TrendMomentumEditor’s pick

Gann Square of 144

by ThiagoSchmitz

A technical analysis tool based on W.D. Gann's Square of 144, helping traders identify potential price targets, support, and resistance levels through geometric price and time calculations.

Main price chart · unverifiedSwing Trading
Explore
2.6Klikes102.3Kviews54comments
Save
TrendMomentumEditor’s pick

Polynomial Regression Bands + Channel [DW]

by DonovanWall

A polynomial regression indicator that calculates complex curve-fitting relationships between price variables, enabling advanced trend analysis and least squares moving average (LSMA) generation.

Main price chart · unverifiedDay Trading · Swing Trading
Explore
2Klikes61.6Kviews42comments
Save
SignalTrend

Trendilo (OPEN-SOURCE)

by dudeowns

Trendilo is a custom TradingView indicator that identifies market trends by analyzing percentage change and using Arnaud Legoux Moving Average with RMS band comparison.

Main price chart · unverifiedScalping · Day Trading
Explore
1.8Klikes43.5Kviews37comments
Save
OscillatorTrendVolatility

Ultimate Bands [BigBeluga]

by BigBeluga

Ultimate Bands is an advanced technical analysis tool that combines volatility bands, oscillators, and trend analysis to provide comprehensive market insights and potential trading signals.

Main price chart · unverifiedScalping · Day Trading
Explore
1.4Klikes22.8Kviews6comments
Save

Likes, views, and comments are historical TradingView snapshots. They describe attention, not trading performance.

START WITH A QUESTION

A little less searching.
A lot more understanding.

Tell DeepAlpha what you need. Get an explanation, a shortlist,
and a direct path to the indicators behind it.

Ask DeepAlpha