YOUR INDICATOR RESEARCH STARTS HERE

Find the right indicator.
Understand what it does.

Explore 11,183 indicators. Filter beyond the obvious.
Discover the tools that fit the way you trade.

THE INDICATOR LIBRARY

Results for “tables”

11,183 tools to explore

43 indicators matching your filters
Save search
TrendMomentumEditor’s pick

Indicator Panel

by LonesomeTheBlue

A dynamic trading panel displaying multiple technical indicators in a color-coded table format, allowing traders to quickly assess market conditions across multiple symbols simultaneously.

Separate pane · unverifiedDay Trading · Swing Trading
Explore
4.6Klikes76.9Kviews80comments
Save
TrendEditor’s pick

Monthly Returns in PineScript Strategies

by QuantNomad

A custom trading tool that generates monthly and yearly performance tables for trading strategies, helping traders analyze historical strategy performance and identify key periods of success or weakness.

Separate pane · unverifiedSwing Trading
Explore
3.2Klikes67.8Kviews78comments
Save
TrendMomentumEditor’s pick

Financial Growth

by morzor61

A financial analysis tool that compares quarterly, annual, and TTM performance metrics, providing comprehensive insights into company growth through various financial indicators and visualization options.

Separate pane · unverifiedSwing Trading
Explore
1.3Klikes35.5Kviews63comments
Save
TrendMomentumEditor’s pick

Financials - Comparing Companies

by LonesomeTheBlue

A Pine Script indicator that compares financial metrics across multiple companies in the same sector, providing comprehensive insights into stock performance using key financial ratios and moving averages.

Main price chartSwing Trading
Explore
1.2Klikes33.1Kviews32comments
Save
Editor’s pick

Portfolio Performance

by QuantNomad

A comprehensive trading script enabling portfolio management and performance analysis with customizable settings for instrument selection, capital allocation, and benchmark comparison.

Main price chart · unverifiedDay Trading · Swing Trading
Explore
1.2Klikes42.5Kviews13comments
Save
TrendEditor’s pick

TA Information Panel

by RicardoSantos

A multiple information panel using tables provides traders with comprehensive visual data representations across various trading metrics, enabling quick and efficient analysis of complex market information.

Separate pane · unverifiedDay Trading · Swing Trading
Explore
1.1Klikes27.2Kviews8comments
Save
VolatilitySignal

Gaps [Kioseff Trading]

by KioseffTrading

A trading indicator that identifies and analyzes price gaps, tracking their occurrence, size, and filling characteristics across different market conditions and timeframes.

Main price chart · unverifiedScalping · Day Trading
Explore
883likes17.8Kviews18comments
Save
VolumeTrendEditor’s pick

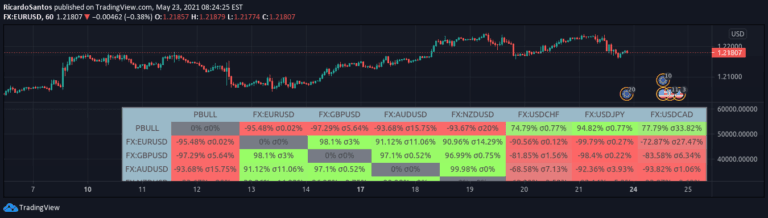
Correlation Matrix Heatmap

by RicardoSantos

A Correlation Matrix utilizes statistical tables to analyze relationships between different financial variables, helping traders understand interconnected market behaviors and potential predictive patterns.

Separate pane · unverifiedSwing Trading
Explore
854likes31.4Kviews13comments
Save
TrendVolatilityEditor’s pick

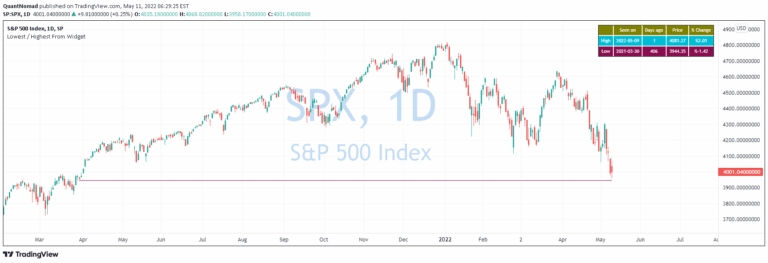
Lowest / Highest From Widget

by QuantNomad

A widget that identifies the most recent day when price was higher or lower than the current value, visualizing historical price comparisons through lines and informative tables.

Main price chart · unverifiedDay Trading · Swing Trading
Explore
815likes45.8Kviews12comments
Save
VolumeTrendEditor’s pick

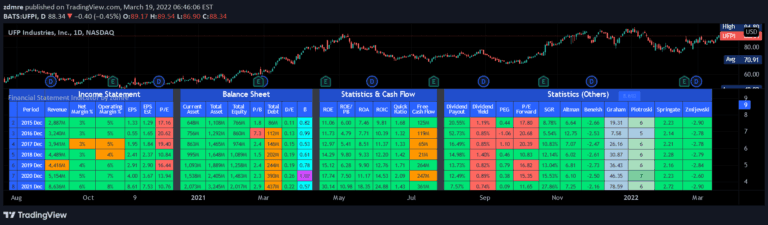
Financial Statement Indicator by zdmre

by zdmre

A comprehensive financial analysis tool that combines key financial statement metrics to assess a company's financial health, performance, and investment potential across income, balance sheet, and cash flow dimensions.

Separate pane · unverifiedSwing Trading
Explore
754likes23.8Kviews28comments
Save
SignalTrendVolatility

Cobra's CryptoMarket Visualizer

by EliCobra

A comprehensive crypto market screener analyzing top 40 cryptocurrencies through multiple performance and risk metrics in an easy-to-read heatmap format.

Separate pane · unverifiedDay Trading · Swing Trading
Explore
657likes10.4Kviews18comments
Save

Likes, views, and comments are historical TradingView snapshots. They describe attention, not trading performance.

START WITH A QUESTION

A little less searching.
A lot more understanding.

Tell DeepAlpha what you need. Get an explanation, a shortlist,
and a direct path to the indicators behind it.

Ask DeepAlpha