Divergence for many indicator v3
A multi-indicator divergence script that analyzes divergences across 10 different technical indicators to identify potential trend reversals and price movements.
Explore 11,183 indicators. Filter beyond the obvious.
Discover the tools that fit the way you trade.
11,183 tools to explore
A multi-indicator divergence script that analyzes divergences across 10 different technical indicators to identify potential trend reversals and price movements.
A trading signal that predicts potential choppiness in New York trading sessions by analyzing price behavior during Asian and London sessions, with customizable success tracking.
A trend reversal probability indicator that uses custom oscillator calculations to estimate market direction shifts and potential trend changes with statistical probability analysis.
A price action indicator that identifies potential mean reversion opportunities by tracking highest and lowest points within a selected lookback period and generating alerts.
An advanced trading indicator combining Kalman Filtering and Supertrend to dynamically analyze market trends, detect price movements, and provide customizable trend signals with precision.
A Pine Script method demonstrating a custom Flare indicator that analyzes price positioning relative to a historical point, using color-coded visual signals to indicate market zones.
A custom logging utility for Pine Script traders to track and debug complex trading indicators by storing messages with timestamps and types for easier code development and analysis.
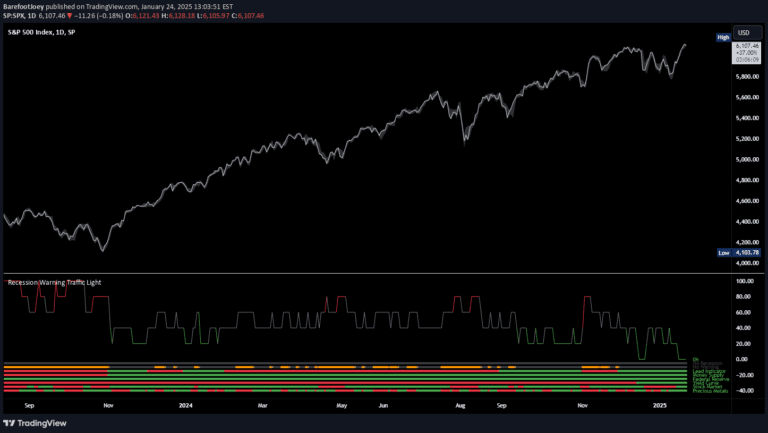
A multi-metric recession probability indicator using six key economic factors to assess potential economic downturns by analyzing various financial and market signals.
A dynamic SuperTrend indicator that uses ATR, HMA, and TEMA to identify market trends, support and resistance levels with enhanced adaptability and volatility assessment.
An adaptive trading indicator using logarithmic price scaling and Nadaraya-Watson estimation to create dynamic price channels that adjust to market conditions and provide potential trading signals.
A flexible EMA cross dashboard that enables traders to analyze exponential moving average crosses across multiple timeframes with customizable settings and sources.
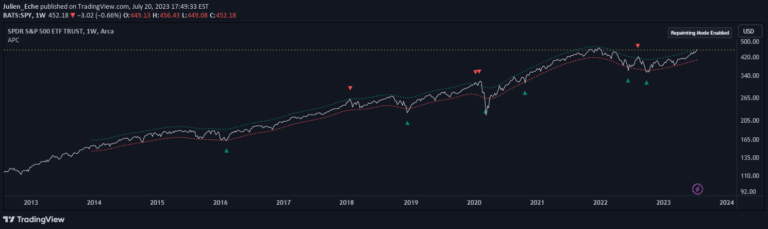
A pullback warning indicator that identifies potential market reversals by measuring distances between key moving averages and assessing price extension from a 50-day SMA.
Likes, views, and comments are historical TradingView snapshots. They describe attention, not trading performance.