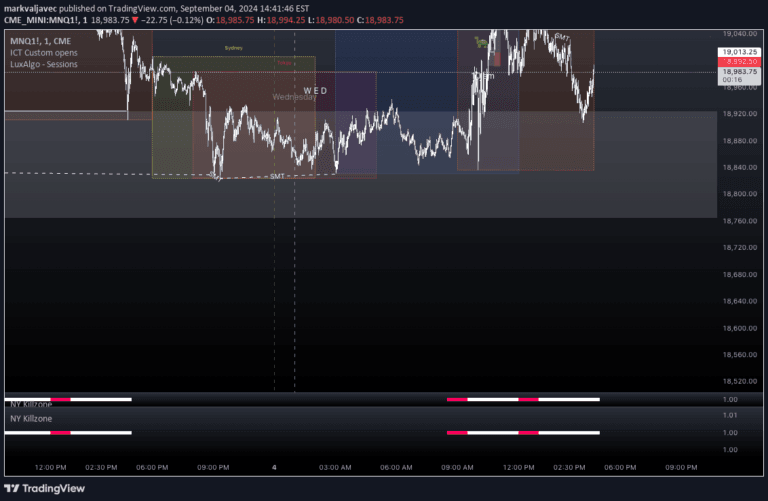
A trading sessions indicator designed to provide precise market session tracking using New York time, ensuring accurate time representation during Daylight Saving Time periods.
Explore complementary indicator rolesHow it works
The sessions indicator operates by mapping market trading periods using New York time as a standardized reference point. It automatically adjusts for Daylight Saving Time transitions, ensuring consistent and accurate session representation across different time zones.
By implementing a fixed time zone approach, the indicator eliminates potential confusion arising from local time zone settings. It provides clear visual demarcations of trading sessions, allowing traders to quickly identify and interpret market activity periods with precision and reliability.
Why it may be useful
Trading session indicators are crucial for understanding market dynamics, helping traders recognize periods of potential high volatility and liquidity. By standardizing time representation, this indicator removes ambiguity and provides a reliable framework for analyzing market behavior across different global exchanges.
The consistent use of New York time ensures that traders can make more informed decisions by understanding precise session boundaries. This approach reduces the risk of misinterpreting market conditions due to time zone discrepancies and supports more strategic trading approaches.
When to explore it
This sessions indicator is most effective for traders who operate across multiple markets or require precise timing information for their trading strategies. It is particularly useful during periods of market transition, such as when exchanges open or close, or during potential high-volatility periods.
Traders focusing on day trading and scalping will find this tool especially valuable, as it provides clear visual cues about active trading sessions. By offering a standardized time reference, the indicator helps traders synchronize their strategies with global market movements and identify optimal entry and exit points.
Keep exploring
What we’ve verified
Access, alerts and repainting behaviour have not been independently verified for this indicator. Check the creator’s current publication and settings.
General descriptions and classifications are recovered research. Verified details above identify the specific checks we have completed. Check the creator’s current publication for later changes.