YOUR INDICATOR RESEARCH STARTS HERE

Find the right indicator.
Understand what it does.

Explore 11,183 indicators. Filter beyond the obvious.
Discover the tools that fit the way you trade.

THE INDICATOR LIBRARY

Results for “Advance/Decline Ratio”

11,183 tools to explore

12 indicators matching your filters
Save search
TrendSignalOscillator

Short Term IndeX

by EliCobra

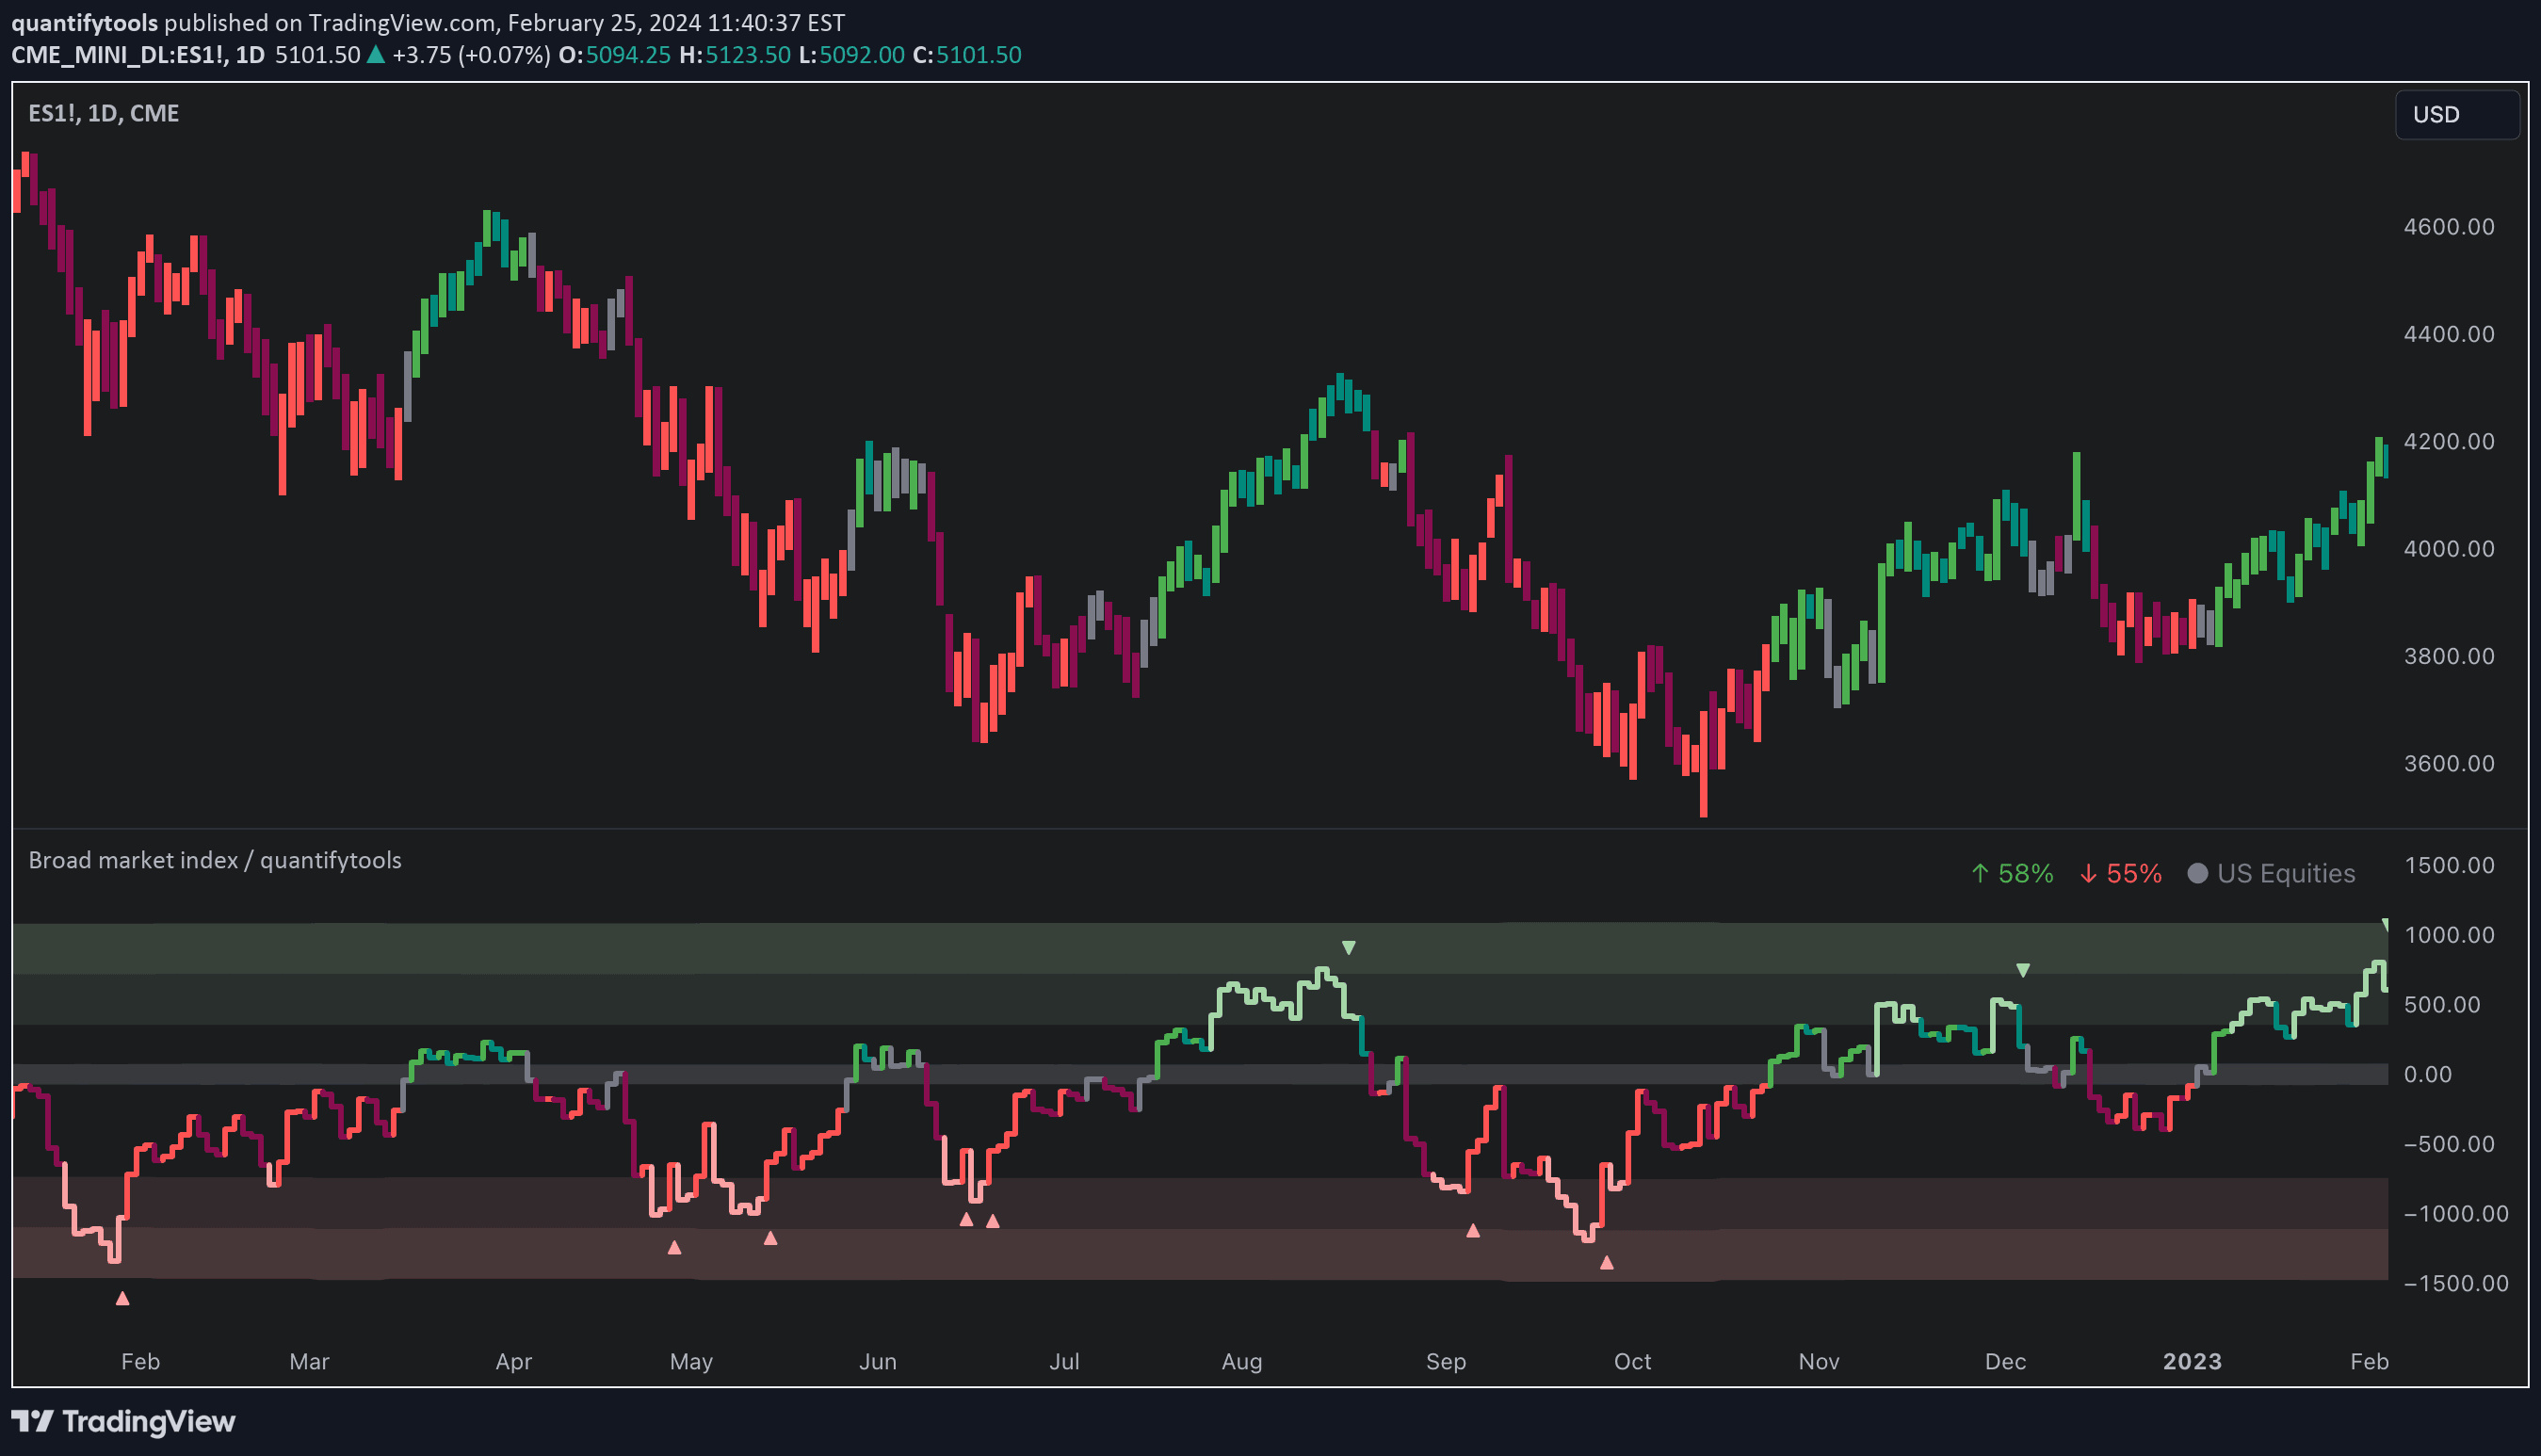
STIX is a market breadth indicator that measures advancing versus declining issues to assess short-term market sentiment and potential overbought or oversold conditions.

Separate pane · unverifiedDay Trading · Swing Trading
Explore
578likes7.9Kviews3comments
Save
Market BreadthTrend

Bolton-Tremblay Index

by EliCobra

The Bolton-Tremblay Index analyzes market trends by tracking advancing, declining, and unchanged securities to provide a comprehensive view of market dynamics and sentiment.

Separate pane · unverifiedDay Trading · Swing Trading
Explore
565likes6Kviews3comments
Save
TrendSignalLevels

Shark Price & Bar Prediction

by CripShark

A trading indicator that detects local price extremes and predicts potential bullish and bearish targets using Volume Spread Analysis and Fibonacci levels for precise market entry points.

Main price chart · unverifiedScalping · Day Trading
Explore
137likes2.8Kviews0comments
Save
Trend

Pearson Correlation [Mr_Rakun]

by Mr_Rakun

Pearson Correlation measures the statistical relationship between two assets' price movements, helping traders understand how different markets interact and potentially move together or inversely.

Separate pane · unverifiedSwing Trading
Explore
127likes1.5Kviews0comments
Save
MomentumSignalTrend

Cumulative Symbol

by TradeSeekers

A price source delta indicator that tracks cumulative price changes using different calculation methods. Offers flexible analysis of price movement across various timeframes and symbols.

Separate pane · unverifiedScalping · Day Trading
Explore
93likes2Kviews4comments
Save
SignalTrend

PSP - NQ ES YM

by Menash100

A futures market correlation indicator that tracks price movements of NQ, ES, and YM indices, highlighting divergence and alignment patterns between major market indices.

Main price chart · unverifiedScalping · Day Trading
Explore
33likes1.2Kviews0comments
Save

Likes, views, and comments are historical TradingView snapshots. They describe attention, not trading performance.

START WITH A QUESTION

A little less searching.
A lot more understanding.

Tell DeepAlpha what you need. Get an explanation, a shortlist,
and a direct path to the indicators behind it.

Ask DeepAlpha