Financial Growth
A financial analysis tool that compares quarterly, annual, and TTM performance metrics, providing comprehensive insights into company growth through various financial indicators and visualization options.
Explore 11,183 indicators. Filter beyond the obvious.
Discover the tools that fit the way you trade.
11,183 tools to explore
A financial analysis tool that compares quarterly, annual, and TTM performance metrics, providing comprehensive insights into company growth through various financial indicators and visualization options.
A Pine Script tool for calculating Compound Annual Growth Rate (CAGR) by interactively selecting two time points on a chart, providing an annualized performance metric.
A CAGR Projection Indicator that visualizes potential asset growth by overlaying a projection line on price charts, enabling comparison of actual performance against hypothetical growth scenarios.
A comprehensive portfolio management tool that helps investors analyze stock performance, evaluate risk factors, and optimize investment strategies using advanced financial metrics.
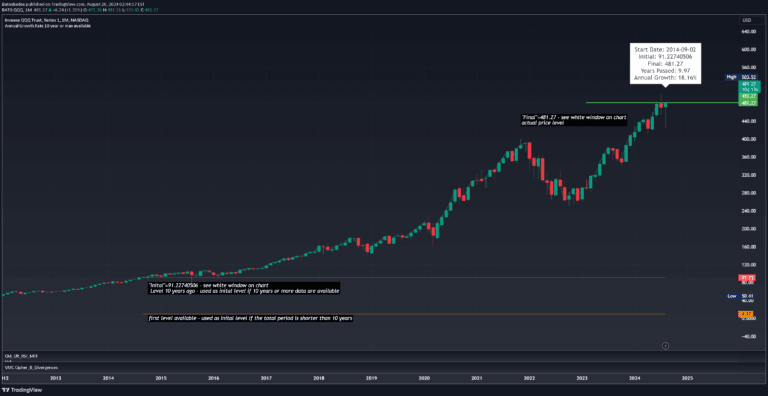
A tool for calculating Compound Annual Growth Rate (CAGR) over a 10-year period to assess the long-term growth potential of investment assets.
An analytical tool that segments stock returns into overnight and intraday components, helping traders understand performance dynamics across different trading periods.
A macroeconomic indicator that adjusts stock prices against money supply, providing a unique perspective on equity performance through normalized growth metrics.
A dynamic indicator that calculates and displays the Compound Annual Growth Rate (CAGR) over a specified historical period, helping traders analyze long-term performance trends in a separate chart pane.
A precise backtesting tool that calculates Compound Annual Growth Rate (CAGR) for individual candles, enabling traders to evaluate investment performance across different market conditions.
A Pine Script indicator that calculates and displays annual performance metrics, providing traders with comprehensive yearly return analysis using arithmetic and geometric mean calculations.
Rolling CAGR tracks the mean annual growth rate of an investment over time, measuring sustained performance through compounding returns across a customizable period.
Likes, views, and comments are historical TradingView snapshots. They describe attention, not trading performance.