RSI cyclic smoothed v2
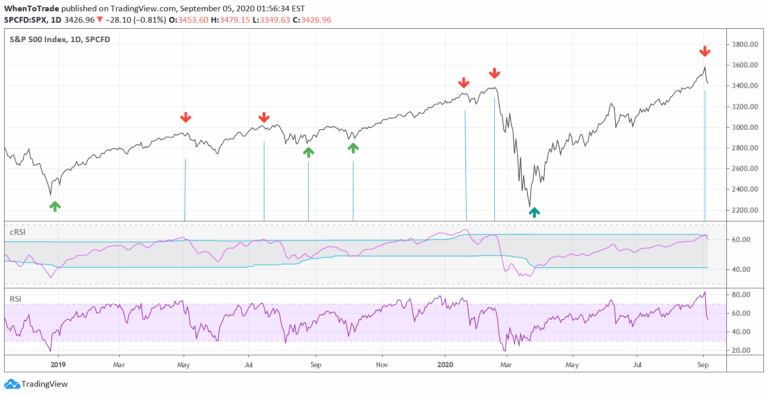
An enhanced RSI indicator that uses cyclic smoothing and adaptive bands to provide more responsive market trend signals by incorporating dominant cycle length.
Explore 11,183 indicators. Filter beyond the obvious.
Discover the tools that fit the way you trade.
11,183 tools to explore
An enhanced RSI indicator that uses cyclic smoothing and adaptive bands to provide more responsive market trend signals by incorporating dominant cycle length.
Advanced machine learning trading strategy utilizing signal processing techniques and custom moving averages to generate precise housing market trading signals and performance metrics.
A Pine Script tool for automatically plotting Fibonacci retracement levels, enabling traders to identify potential support and resistance areas within a customizable date range.
An advanced volume analysis tool that visualizes supply and demand dynamics by tracking buyer and seller strength within candlesticks, helping traders understand market momentum and potential trend reversals.
An AI-powered trading indicator that uses k-Nearest Neighbors algorithm to analyze price patterns, predict market movements, and identify trend shifts with advanced multivariate pattern recognition.
An advanced trading concept that identifies overnight price gaps in futures markets, using specific time frames and standard deviation projections to analyze potential market movements and liquidity zones.
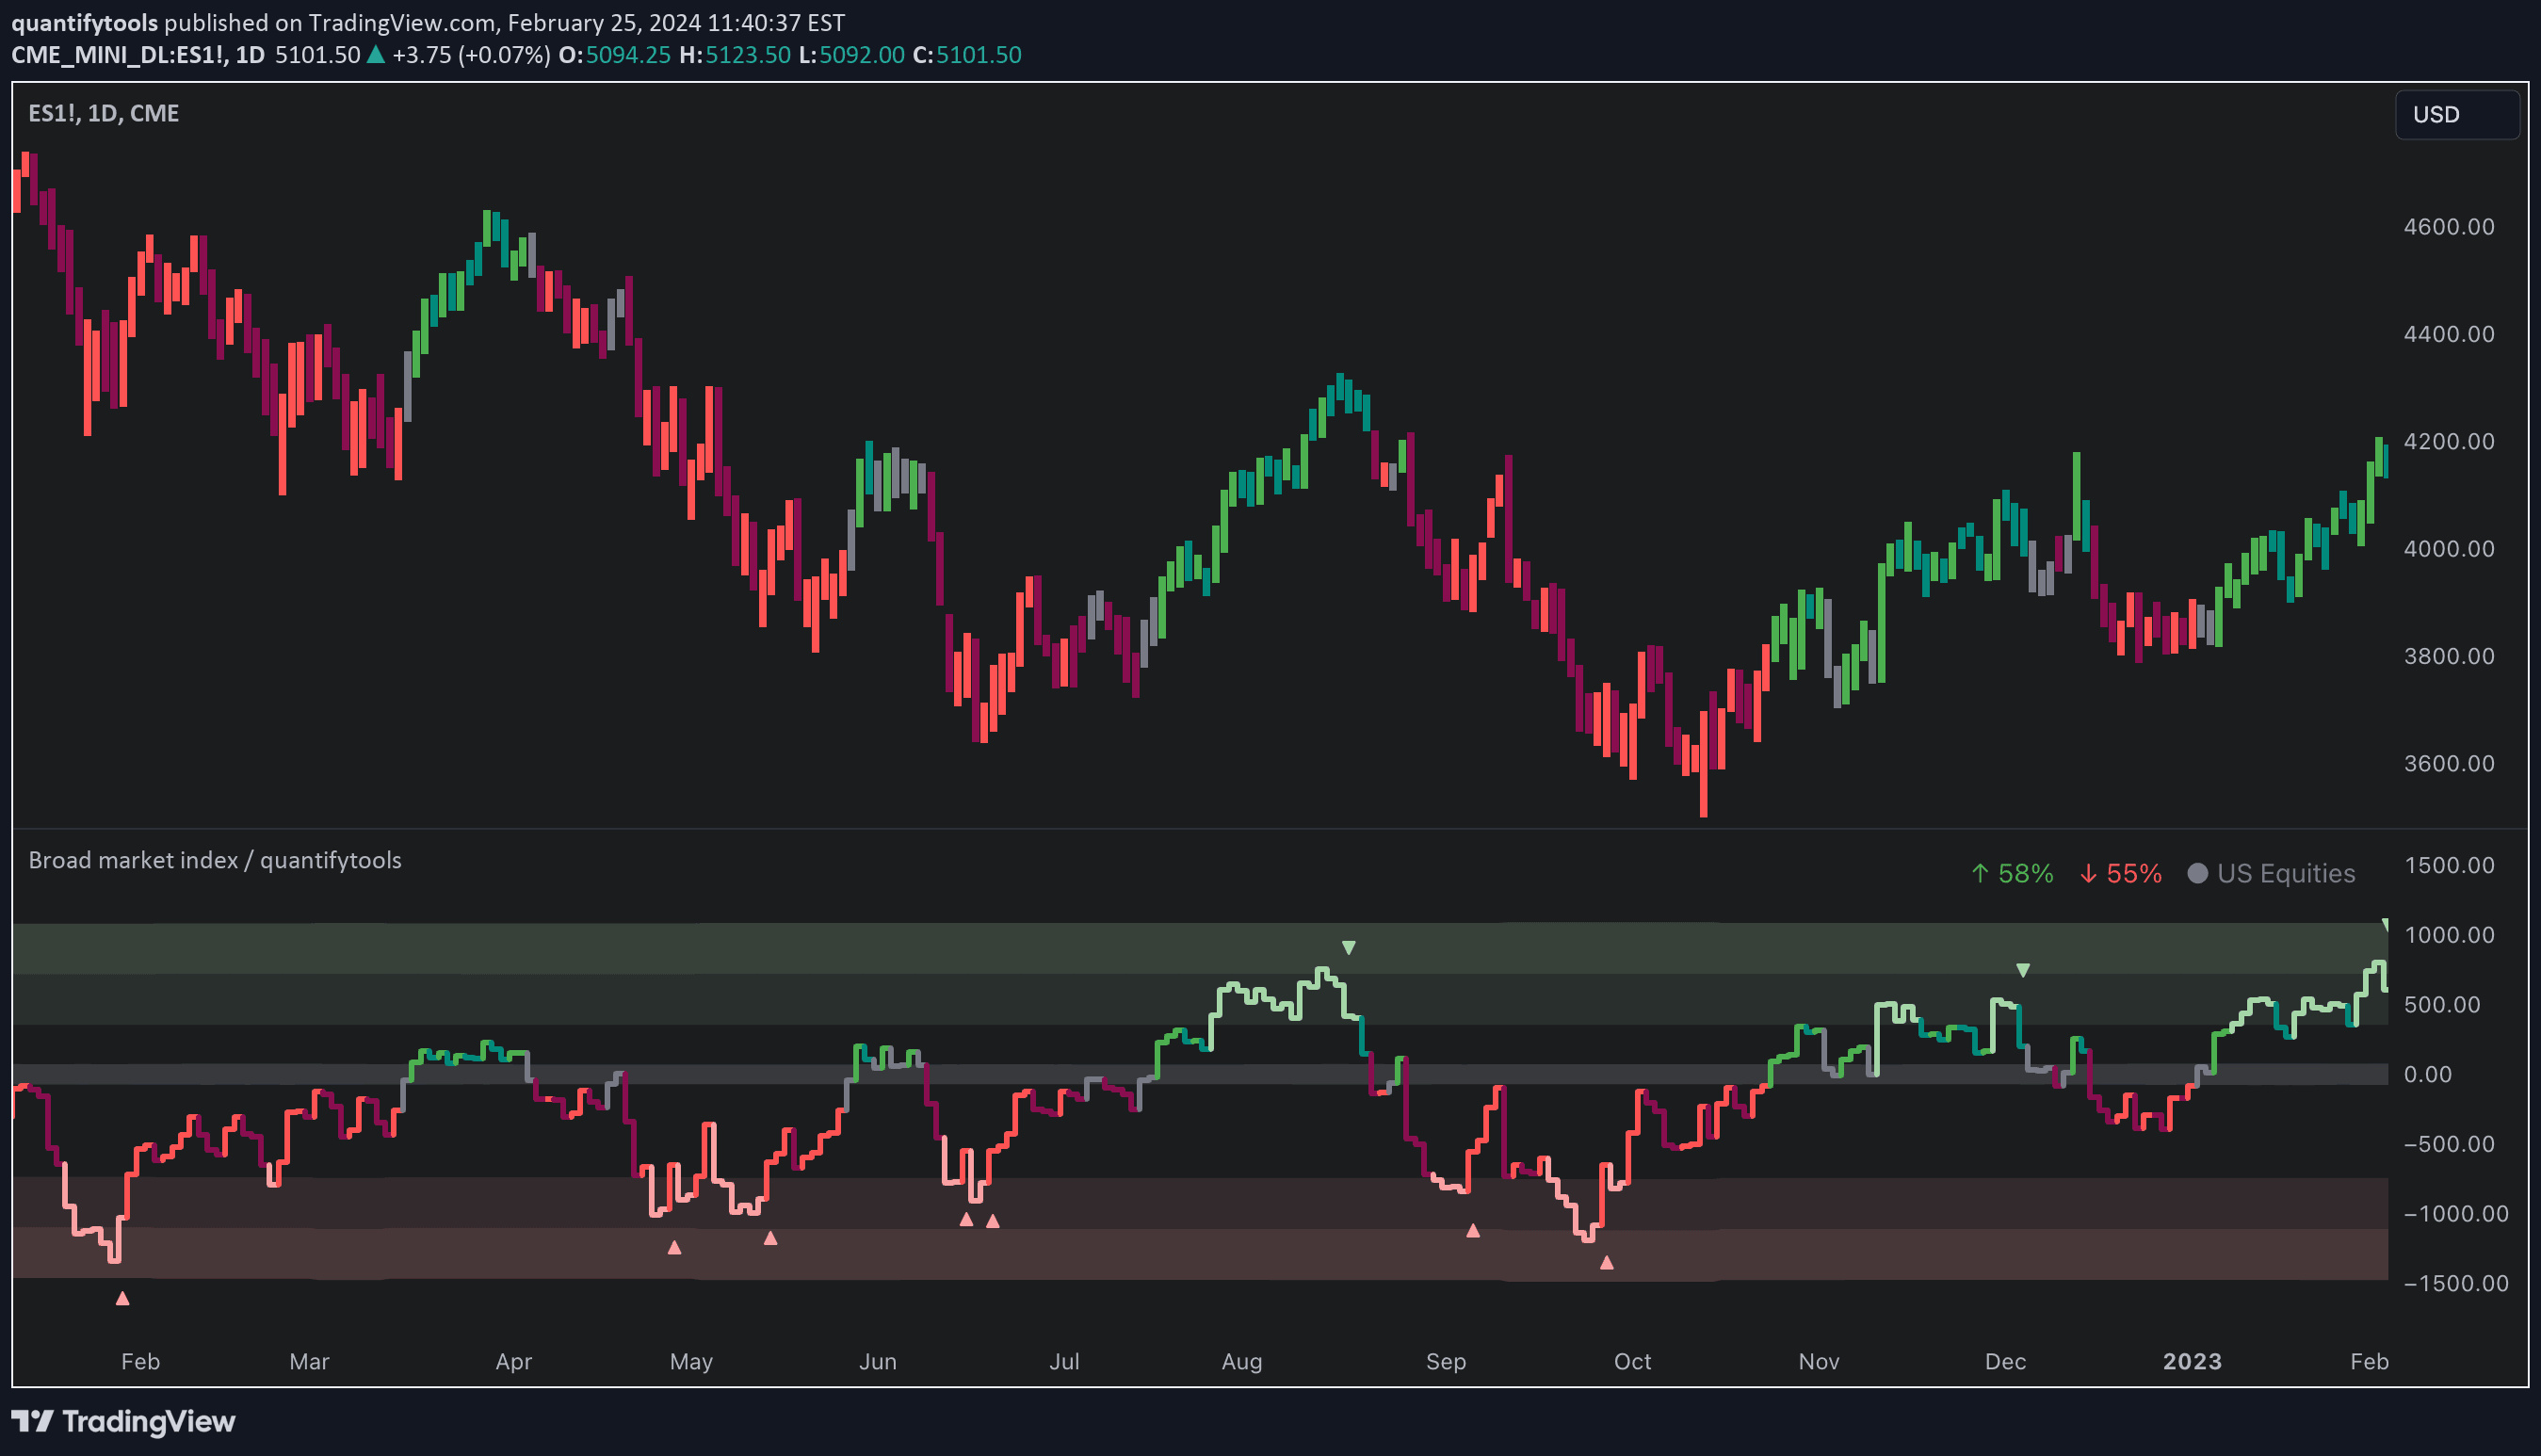
Market breadth indicator analyzing the ratio of advancing versus declining symbols to determine overall market trend and potential reversals in broad market movements.
STIX is a market breadth indicator that measures advancing versus declining issues to assess short-term market sentiment and potential overbought or oversold conditions.
The Bolton-Tremblay Index analyzes market trends by tracking advancing, declining, and unchanged securities to provide a comprehensive view of market dynamics and sentiment.
A custom trading indicator using RSI and SMA to generate buy, sell, and reversal signals by analyzing price momentum and moving average trends.
On-Balance Accumulation Distribution (OBAD) is a volume-weighted indicator that analyzes buying and selling pressure to help traders identify market trends and potential reversals.
A custom signal indicator that allows manual signal generation through mouse clicks or bar selection, designed to work with the Template Trailing Strategy for flexible trading setups.
Likes, views, and comments are historical TradingView snapshots. They describe attention, not trading performance.