Liquidity Price Depth Chart [LuxAlgo]
A depth chart visualizing price liquidity by mapping bullish and bearish price variations, highlighting volume clusters and potential support/resistance zones across trading ranges.
Explore 11,183 indicators. Filter beyond the obvious.
Discover the tools that fit the way you trade.
11,183 tools to explore
A depth chart visualizing price liquidity by mapping bullish and bearish price variations, highlighting volume clusters and potential support/resistance zones across trading ranges.
A performance evaluation tool that calculates risk-adjusted return metrics like Sharpe, Sortino, and Omega Ratios to help traders assess investment performance and risk.
A comprehensive crypto market screener analyzing top 40 cryptocurrencies through multiple performance and risk metrics in an easy-to-read heatmap format.
A comprehensive risk analysis tool that calculates Sharpe and Sortino ratios to evaluate investment performance relative to risk, helping traders assess the efficiency of their trading strategies.
A comprehensive risk assessment tool that dynamically calculates multiple performance metrics, providing investors with adaptive insights into investment volatility, drawdown, and risk-adjusted returns.
A comprehensive financial analysis tool that provides deep insights into asset performance, risk metrics, and market behavior through advanced quantitative indicators and visualization.
A statistical method measuring non-linear correlation between two market variables like volume and trend, using Chatterjee Correlation Coefficient to understand potential relationships.
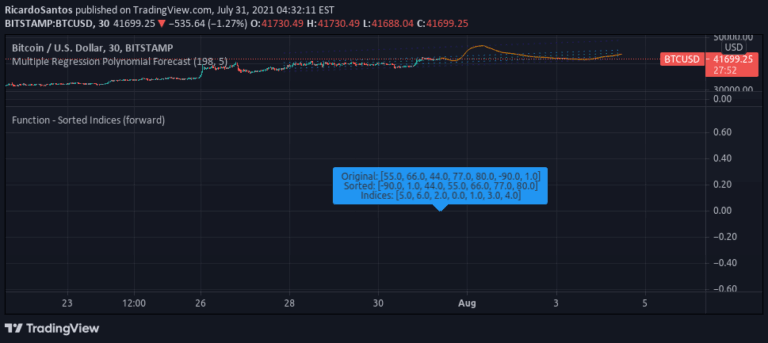
A function that sorts indices in an array using bubble sort algorithm, providing a method to organize and arrange data elements based on their values from lowest to highest.
A systematic approach to sorting stock tickers alphabetically and displaying their current prices in a table format using advanced programming techniques.
A comprehensive trading tool that compares Sharpe, Sortino, and Omega ratios across multiple assets to evaluate risk-adjusted performance and investment efficiency.
RSI Overlay Table tracks Relative Strength Index across multiple tickers, providing real-time overbought and oversold conditions for up to 30 assets simultaneously.
A custom volume profile indicator that visualizes trading volume distribution across price levels, allowing traders to identify key volume-based support and resistance zones dynamically.
Likes, views, and comments are historical TradingView snapshots. They describe attention, not trading performance.