Heatmap Volume [xdecow]
A volume heat map indicator that colors volume bars and candles based on the standard deviation of trading volume from its average. Provides visual insights into volume intensity and potential market significance.
Explore 11,183 indicators. Filter beyond the obvious.
Discover the tools that fit the way you trade.
11,183 tools to explore
A volume heat map indicator that colors volume bars and candles based on the standard deviation of trading volume from its average. Provides visual insights into volume intensity and potential market significance.
An advanced stop-loss strategy that uses volume, price, and volatility to dynamically adjust stop-loss levels, helping traders manage risk by considering individual security characteristics.
A generalized Gaussian filter that smooths price data with variable pole orders, reducing noise and high-frequency market movements using advanced signal processing techniques.
Follow Line is a trend-following indicator that tracks price movements relative to Bollinger Bands, generating buy and sell signals based on price volatility and directional changes.
A sophisticated technical analysis tool combining LOWESS smoothing and adaptive Gaussian moving average to detect trends, pivot points, and breakouts with enhanced market dynamics visualization.
A comprehensive divergence analysis tool that calculates divergence strength across multiple indicators, providing a single metric to assess potential market reversals and trend shifts.
Fair value bands assess price behavior by tracking deviations from a mean basis, helping traders identify normal and abnormal price movements through dynamic statistical bands.
A comprehensive volume analysis tool that examines trading volume dynamics, measuring market participation, interest, and potential price movement signals through multiple volume-based indicators.
An advanced technical indicator using dual EMAs and volatility-adjusted bands to detect market trends, providing dynamic and adaptive trend analysis across different market conditions.
A performance evaluation tool that calculates risk-adjusted return metrics like Sharpe, Sortino, and Omega Ratios to help traders assess investment performance and risk.
The Relative Trend Index (RTI) is an advanced technical indicator that measures trend strength by analyzing price positioning within its recent range, offering more adaptive insights than traditional momentum tools.
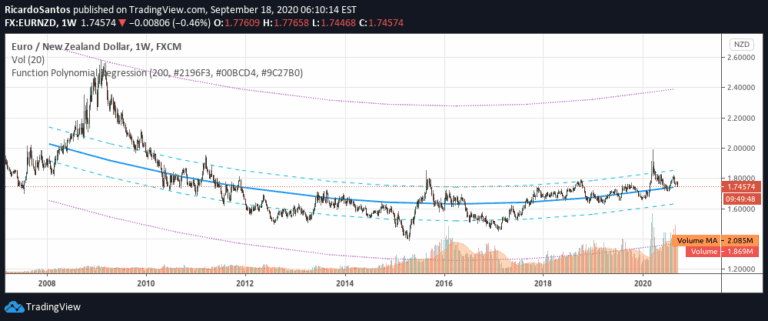
A polynomial regression function that analyzes data points to provide predictions, deviations, and statistical insights about trend and momentum patterns in financial datasets.
Likes, views, and comments are historical TradingView snapshots. They describe attention, not trading performance.