Anti-Volume Stop Loss
An advanced stop-loss strategy that uses volume, price, and volatility to dynamically adjust stop-loss levels, helping traders manage risk by considering individual security characteristics.
Explore 11,183 indicators. Filter beyond the obvious.
Discover the tools that fit the way you trade.
11,183 tools to explore
An advanced stop-loss strategy that uses volume, price, and volatility to dynamically adjust stop-loss levels, helping traders manage risk by considering individual security characteristics.
A generalized Gaussian filter that smooths price data with variable pole orders, reducing noise and high-frequency market movements using advanced signal processing techniques.
Follow Line is a trend-following indicator that tracks price movements relative to Bollinger Bands, generating buy and sell signals based on price volatility and directional changes.
A sophisticated technical analysis tool combining LOWESS smoothing and adaptive Gaussian moving average to detect trends, pivot points, and breakouts with enhanced market dynamics visualization.
An advanced technical indicator using dual EMAs and volatility-adjusted bands to detect market trends, providing dynamic and adaptive trend analysis across different market conditions.
A performance evaluation tool that calculates risk-adjusted return metrics like Sharpe, Sortino, and Omega Ratios to help traders assess investment performance and risk.
The Relative Trend Index (RTI) is an advanced technical indicator that measures trend strength by analyzing price positioning within its recent range, offering more adaptive insights than traditional momentum tools.
A Bollinger Bands upgrade using Nadaraya-Watson estimator to reduce noise and provide smoother price movement analysis with weighted kernel smoothing.
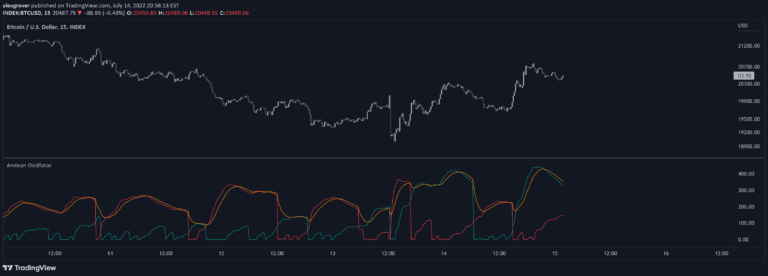
The Andean Oscillator is a trend analysis indicator that measures price variations by comparing bullish and bearish components to identify market direction and potential trend shifts.
A technical indicator that identifies areas of strong buying and selling pressure by calculating price deltas and using standard deviation to highlight significant market activity zones.
A volatility indicator using VIX to measure price deviation from VWAP, primarily designed for SPY. It calculates standard deviation moves based on implied volatility, helping traders understand potential price ranges.
A comprehensive trading toolkit that combines momentum, volatility, and price action analysis to provide insights into market trends, momentum, and potential reversals.
Likes, views, and comments are historical TradingView snapshots. They describe attention, not trading performance.