VolumeHeatmap | Experimental Version of Marketorders Matrix
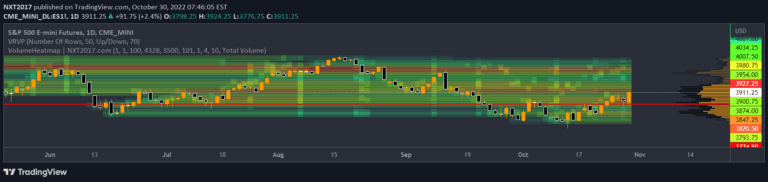
A volume heatmap indicator that identifies price levels with the most trading volume, helping traders find key market activity zones and potential value trading targets.
Explore 11,183 indicators. Filter beyond the obvious.
Discover the tools that fit the way you trade.
11,183 tools to explore
A volume heatmap indicator that identifies price levels with the most trading volume, helping traders find key market activity zones and potential value trading targets.
A volume profile matrix indicator that calculates trading activity across a grid of intervals, revealing liquidity and high-volume price levels using color-coded cells.
A polynomial regression indicator that calculates complex curve-fitting relationships between price variables, enabling advanced trend analysis and least squares moving average (LSMA) generation.
A dynamic moving average panel that reveals market sentiment by displaying the direction of multiple moving averages across different time periods, helping traders understand trend dynamics.
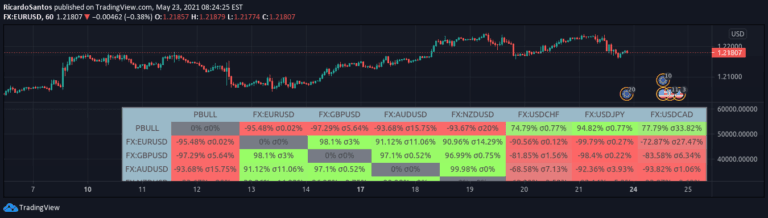
A correlation matrix tool that visualizes relationships between 10 different assets, revealing how different securities move in relation to each other using statistical coefficients.
A comprehensive trading matrix that analyzes trend performance across multiple assets using customizable indicators to compare relative strength and identify top-performing investments.
A Correlation Matrix utilizes statistical tables to analyze relationships between different financial variables, helping traders understand interconnected market behaviors and potential predictive patterns.
An AI-powered trading indicator that uses k-Nearest Neighbors algorithm to analyze price patterns, predict market movements, and identify trend shifts with advanced multivariate pattern recognition.
A sophisticated trading tool that identifies institutional liquidity levels and key market dynamics across multiple timeframes, helping traders make informed trading decisions.
Order Block Matrix identifies key supply and demand zones using volume profile and price action to help traders recognize high-probability trading opportunities and institutional activity.
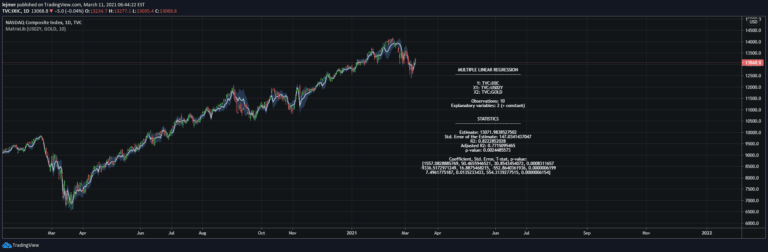
A comprehensive matrix math library for Pine Script that enables advanced mathematical operations, multiple linear regression, and solving complex linear equation systems for trading analysis.
A comprehensive multi-timeframe trend analysis dashboard that combines multiple technical indicators to provide traders with a clear, concise view of market direction across different time periods.
Likes, views, and comments are historical TradingView snapshots. They describe attention, not trading performance.