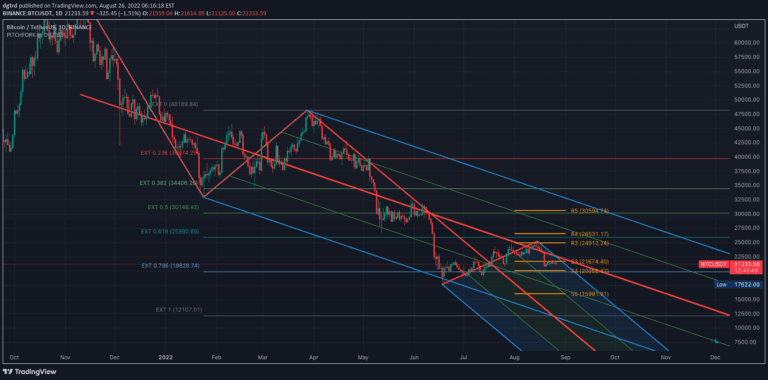
Auto Pitchfork, Fib Retracement and Zig Zag by DGT
Pitchfork is a technical indicator that helps traders identify potential support and resistance levels by drawing trend lines based on three strategic points in price movement.
Explore 11,183 indicators. Filter beyond the obvious.
Discover the tools that fit the way you trade.
11,183 tools to explore
Pitchfork is a technical indicator that helps traders identify potential support and resistance levels by drawing trend lines based on three strategic points in price movement.
A dynamic indicator that identifies potential liquidity pools by tracking price interactions with specific zones, helping traders anticipate market movements and institutional trading strategies.
A liquidity indicator that identifies potential market order zones by mapping swing highs and lows, revealing where stop-loss orders and significant liquidity pools are likely positioned.
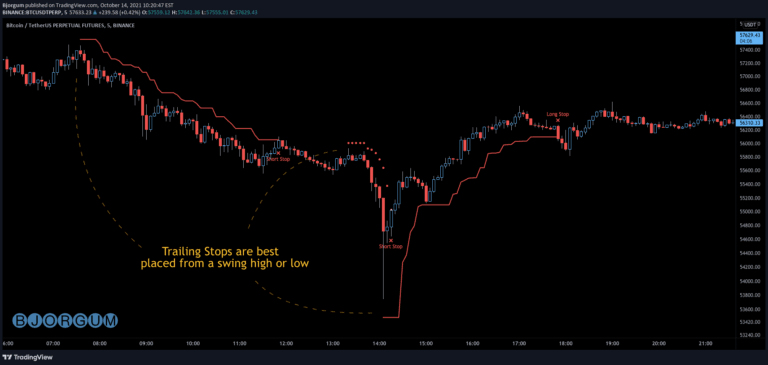
A versatile trailing stop management script for crypto and forex traders, offering multiple trail types to protect profits and manage risk dynamically during ongoing trades.
A dynamic trend channel indicator that identifies market trends, projects future prices, and provides visual signals for potential trade opportunities using SMA and volatility calculations.
A comprehensive volume profile tool that analyzes trading activity across multiple time resolutions, revealing market structure, price acceptance zones, and directional volume pressure.
A trading signal that predicts potential choppiness in New York trading sessions by analyzing price behavior during Asian and London sessions, with customizable success tracking.
A multi-indicator trading tool that uses Ehlers' bandpass filter and Voss predictor to anticipate potential cyclic turning points in market price movements.
A trading signal that identifies potential turning points in asset prices by highlighting support and resistance levels with customizable display options.
A trading indicator that identifies liquidity sweeps and major liquidation events, helping traders anticipate market reversals and structure shifts through advanced volume and trend analysis.
A trading indicator that highlights previous market highs and lows, creating customizable support and resistance zones across multiple timeframes to help traders identify potential price reaction levels.
An advanced trading indicator that analyzes open interest and price action to visualize market positioning, tracking net long and short positions with multiple analytical tools.
Likes, views, and comments are historical TradingView snapshots. They describe attention, not trading performance.